Published: June 13, 2025 | Updated: August 2, 2026
COST & VIABILITY
Run Japan’s nine “promising zones” under exactly the same assumptions as the promotion zones and LCOE (levelized cost of energy: the cost per kWh generated) spreads from about 22.1 to 34.7 JPY/kWh on the 3% real WACC used in Japanese government cost materials, or 23.8 to 37.9 JPY/kWh once withdrawal risk is priced in at 4%. The headline result: Sakata in Yamagata comes in below every promotion zone already in auction. Promising zones are not a second tier that failed to make the cut. For anyone reading what Round 4 will look like, this ordering matters.
👉 Japan’s Offshore Wind Promising Zone Projects: Candidate Areas for Upcoming Auctions
→
Execution Reality
→
Bankability Test
Sakata, Yamagata prices at 22.1 JPY/kWh on the policy basis, below Happo-Noshiro in Akita (23.1), the strongest promotion zone. On cost at least, the assumption that promising zones are the weaker set does not hold.
Gan-wu-Minami-goshi in Hokkaido sits just 3 km in a straight line from its grid connection, the shortest of the nine, yet reaches 34.7 JPY/kWh. Water depth of 44 m and a 36.6% capacity factor override the advantage. Grid proximity alone does not carry a project.
Aomori Offshore (Japan Sea North) has the strongest wind of the nine at a 48.0% capacity factor, but 40 m water and a 90 km run to the base port lift CAPEX enough to leave LCOE at 29.2 JPY/kWh. A wind advantage can be cancelled elsewhere.
The nine zones have changed since the last review
The line-up has turned over in the past year. Hiyama and Matsumae in Hokkaido moved up to promotion zone status and are now Round 4 candidates. Akita City and Hibikinada in Fukuoka came in to replace them. The count is still nine; the contents are not the same.
| Promising zone | Capacity (MW) |
Capacity factor (%) |
Water depth (m) |
Grid distance straight line (km) |
Base port (km) |
|---|---|---|---|---|---|
| Ishikari, Hokkaido | 1,140 | 46.3 | 26 | 24 | 25 |
| Gan-wu-Minami-goshi, Hokkaido | 705 | 36.6 | 44 | 3 | 130 |
| Shimamaki, Hokkaido | 555 | 41.0 | 20 | 21 | 160 |
| Aomori Offshore (Japan Sea North) | 300 | 48.0 | 40 | 22 | 90 |
| Akita City, Akita | 360 | 44.0 | 19 | 13 | 10 |
| Sakata, Yamagata | 495 | 43.4 | 11 | 5 | 5 |
| Isumi, Chiba | 390 | 45.6 | 14 | 33 | 100 |
| Kujukuri, Chiba | 405 | 40.9 | 16 | 15 | 80 |
| Hibikinada, Fukuoka | 480 | 37.6 | 21 | 7 | 15 |
Source: capacities organised by DeepWind from METI Agency for Natural Resources and Energy public materials on a 15 MW turbine basis. Capacity factors derived from NEDO NeoWins wind statistics with the IEA Wind 15-MW reference turbine power curve (gross, before losses). Depths and distances are DeepWind estimates.
Identical assumptions to the promotion zone analysis
Nothing in the assumption set differs from the promotion zone pillar. Removing price and policy differences is what lets site and structure show through.
- Operating life: 30 years
- Real WACC used to discount LCOE: shown on two bases, 3% (policy) and 4% (risk-adjusted) (real terms, constant 2026 JPY)
- Assumed off-take price: 30 JPY/kWh (identical for all zones)
- Exchange rate: USD/JPY 160
- Grid connection distance: straight-line distance multiplied by 1.45 to reflect transmission routing
- IRR is an unlevered project IRR (the return on the project itself, with no debt assumed)
Two discount rates are shown because there are two questions. 3% is the rate used in Japanese government cost materials: it answers what the project costs society. 4% is the rate DeepWind applies once withdrawal risk is priced in, given that developers have in fact walked away from awarded projects. The gap between them is what this table is for.
Grid connection distance is the straight-line distance from the shore to the connecting substation, multiplied by 1.45 to allow for routing. Off Tsugaru City in Aomori, a straight-line span of roughly 38 km corresponds to an onshore transmission line of about 55 km, as reported on 1 August 2026 (ATV Aomori Television). Transmission lines avoid mountainous terrain and follow existing corridors, so straight-line distance always understates the length actually built.
Where the nine zones land
| Promising zone | LCOE policy basis 3% (JPY/kWh) |
LCOE risk-adjusted 4% (JPY/kWh) |
Project IRR (%) |
|---|---|---|---|
| Sakata, Yamagata | 22.1 | 23.8 | 7.2 |
| Akita City, Akita | 23.7 | 25.7 | 6.0 |
| Isumi, Chiba | 23.9 | 25.9 | 5.9 |
| Ishikari, Hokkaido | 25.2 | 27.4 | 5.1 |
| Kujukuri, Chiba | 25.5 | 27.7 | 5.0 |
| Aomori Offshore (Japan Sea North) | 26.8 | 29.2 | 4.3 |
| Shimamaki, Hokkaido | 27.3 | 29.7 | 4.1 |
| Hibikinada, Fukuoka | 27.8 | 30.1 | 4.0 |
| Gan-wu-Minami-goshi, Hokkaido | 34.7 | 37.9 | 1.4 |
Source: DeepWind Viability Simulator (assumptions: 30-yr life, 3% and 4% real WACC, 30 JPY/kWh off-take, USD/JPY 160, grid distance = straight line × 1.45). Indicative relative comparison, not project-specific forecasts.
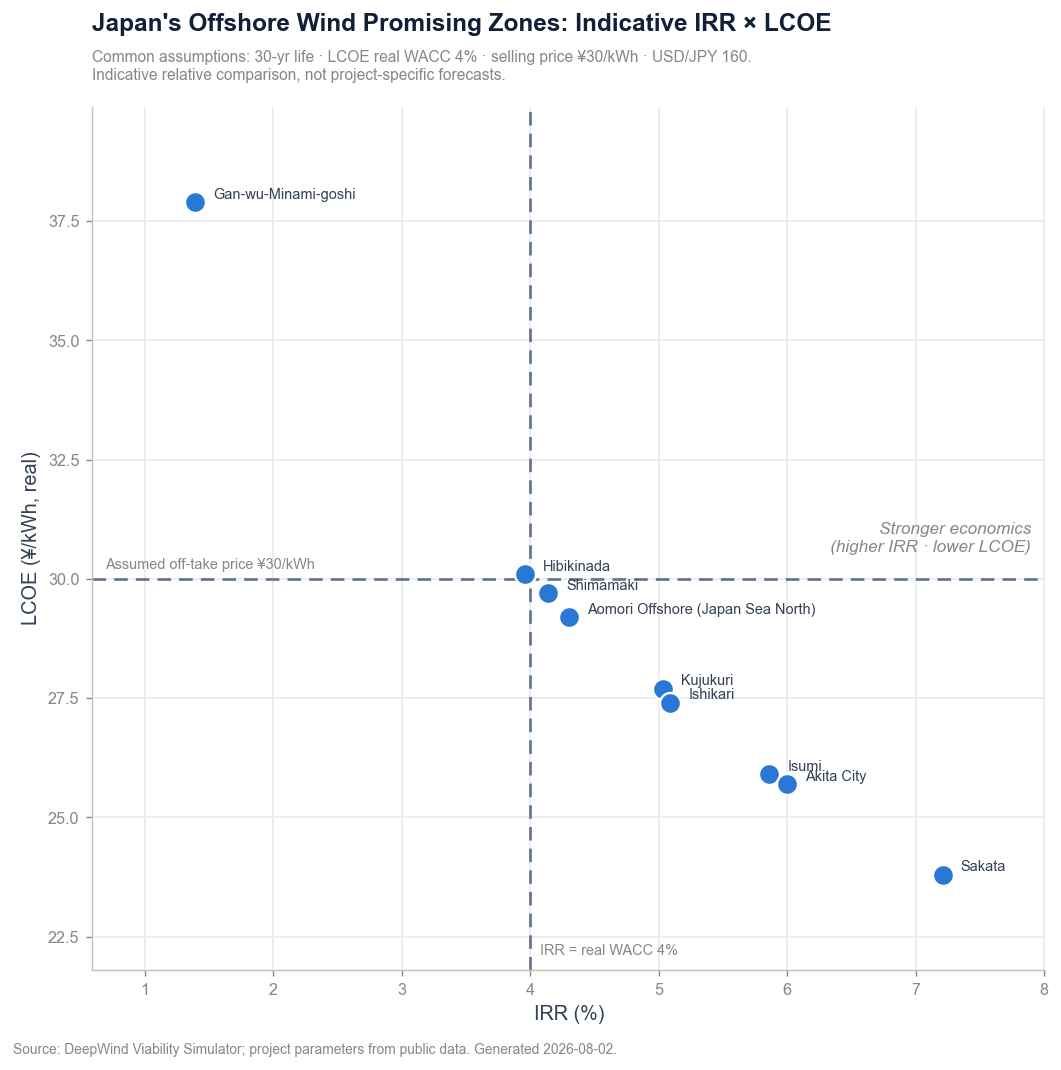
Figure 1: Relative economics of the promising zones (IRR × LCOE), risk-adjusted case at 4% real WACC
IRR on the x-axis, LCOE on the y-axis. Lower-right (higher IRR, lower LCOE) is relatively stronger. The dashed lines mark the 30 JPY assumed off-take price and the 4% real WACC. Only zones to the lower-right of the crosshair earn above their cost of capital under these assumptions.
Source: DeepWind Viability Simulator, 2026-08. Assumptions: 30-yr life, 4% real WACC (risk-adjusted case), 30 JPY/kWh, USD/JPY 160, grid distance = straight line × 1.45.
On the risk-adjusted 4% basis, seven of the nine sit inside the 30 JPY off-take line. The two outside are Hibikinada (30.1) and Gan-wu-Minami-goshi (37.9). Shift to the 3% policy basis and only Gan-wu-Minami-goshi remains outside. Which side of the line Hibikinada falls on is decided by the discount rate, not by the site.
The cheapest zone is cheaper than anything already in auction
The striking result is where Sakata sits: 22.1 JPY/kWh on the policy basis and 23.8 risk-adjusted. That is below Happo-Noshiro in Akita (23.1 policy basis), the strongest of the twelve promotion zones.
Nothing in the assumptions produces that. It comes straight from the site. Water depth of 11 m is the shallowest of the nine, the grid connection is 5 km away in a straight line, and the base port is 5 km. The capacity factor of 43.4% is solid. Shallow, close and windy, all three at once. It is the same structure that puts the Akita and Yamagata zones at the top of the promotion zone table, and Sakata sits on that same coast.
👉 Cost Realities of Japan’s Offshore Wind: LCOE and IRR Across 12 Promotion Zones
Reading promising zones as the areas that fell short of promotion status leads to the wrong conclusion. Designation order is not economics order. Moving to promotion zone status also turns on local consenting progress, available grid capacity and secured port access, none of which is a cost input. Sakata pricing below zones already in auction shows that regulatory stage and project viability are separate things.
Why a 3 km grid run does not save Gan-wu-Minami-goshi
Gan-wu-Minami-goshi is the clearest outlier of the nine: 34.7 JPY/kWh on the policy basis, 37.9 risk-adjusted, and a project IRR of 1.4%. At an assumed 30 JPY off-take it is nowhere close.
What makes that surprising is the grid distance. At 3 km in a straight line it is the shortest of the nine. In the promotion zone analysis, grid distance was one of the strongest single drivers of LCOE. Here that advantage does nothing.
Two other factors override it. Water depth of 44 m is the deepest of the nine, and fixed-bottom foundation cost scales roughly with depth. The capacity factor of 36.6% is the lowest of the nine. Costs rise on one side while output falls on the other, and LCOE is pushed up from both. A 130 km run to the base port adds installation cost on top.
Gan-wu-Minami-goshi shows the risk of judging viability on a single metric. Grid proximity is a genuinely strong driver, but if depth, wind resource or port distance breaks badly enough, that advantage disappears. Screening zones on “is the grid close” alone invites a build phase in which foundation and installation costs run past the assumption set.
Best wind, mid-table result: Aomori Offshore (Japan Sea North)
The mirror case is Aomori Offshore (Japan Sea North). Its 48.0% capacity factor is the highest of the nine and would rank well among the promotion zones too. Yet LCOE lands at 26.8 policy basis and 29.2 risk-adjusted, sixth of nine.
Water depth of 40 m and a 90 km base port run explain it. Strong wind lifts output; deep water and a distant port lift CAPEX. The two offset, and the result is a mid-table position.
Hibikinada in Fukuoka makes the same point from the other direction. Its grid run is 7 km, its base port 15 km, and 21 m of water is workable, but a 37.6% capacity factor pushes it to 30.1 JPY/kWh risk-adjusted and just outside the hurdle. Some zones win on proximity and lose on wind; others win on wind and lose on depth and distance.
The IRR here is an unlevered project return. In real project finance, whether the deal secures funding turns on holding DSCR (debt-service coverage ratio) above a threshold. DeepWind’s guide is Strong ≥1.35x, Borderline 1.20 to 1.35x, Difficult <1.20x. Aomori North, Shimamaki and Hibikinada all sit near a 4% project IRR and would leave thin DSCR headroom once debt is layered on, so financing terms would be tighter. Sitting inside the hurdle line and securing debt are different tests.
The ordering of the promising zones is already telling you how hard Round 4 will be.
What these nine reveal is a wider spread of conditions than the promotion zones carry. The promotion zones concentrated on the shallow water off Akita and Yamagata. The promising zones run from Hokkaido to Kyushu, with depth ranging from 11 m to 44 m. The gap between cheapest and dearest is 12.6 JPY on the policy basis and 14.1 risk-adjusted, wider than the range across the eleven fixed-bottom promotion zones.
That is what a pipeline moving from the easy water to the difficult water looks like. Sakata matches the top of the promotion zone table, while Gan-wu-Minami-goshi cannot reach the assumed off-take price at all, and both sit inside the same designation. The single label “promising zone” is covering a set with materially different levels of difficulty, which is worth holding in mind when reading how the next auction is designed.
The zones to watch are the ones that move across the line. Hibikinada is inside at 3% and outside at 4%. For sites near that boundary, the cost of capital the policy framework assumes is what decides whether the project stands up.
Related DeepWind Articles
- Japan’s Offshore Wind Promising Zone Projects: Candidate Areas for Upcoming Auctions
- Cost Realities of Japan’s Offshore Wind: LCOE and IRR Across 12 Promotion Zones
- Offshore Wind Cost Structure and Economics: A Complete Guide
DeepWind Weekly tracks Japan’s offshore wind market beyond headline announcements, focusing on execution risk, cost structure, project viability, supply-chain constraints, and policy implications.
Subscribe to receive weekly intelligence on Japan’s offshore wind market.
Why Isn't Floating Wind Bankable in Japan Yet?
The synchronized supply-chain bottleneck, quantified node by node, with a full sensitivity ranking and a bankability ladder of scaling conditions. Includes Simulator Professional (β) access to reproduce every figure on your own assumptions.
See the full analysis →