1. Positioning and Background of This Update
In the Japanese offshore wind market, the focus of project evaluation has shifted alongside the progress of the “Promotion Zone” system. While early discussions centered on “how much LCOE could be reduced,” the market has now entered a phase where overall project bankability, including IRR, is more critically scrutinized.
Furthermore, changes in the external environment—such as fluctuating exchange rates, rising procurement costs, and revisions to regulatory and financial conditions—have made it difficult to rely on past cost assumptions.
In this Pillar article, we use DeepWind’s latest cost model to provide a relative comparison of promotion zone projects across two axes: IRR x LCOE. Our goal is to clarify which projects are relatively more viable and where structural constraints exist.
Promotion Zone Map
You can click on the markers in the map to view outline of the projects.
2. Assumptions and Methodology (Key Considerations)
The figures and positions presented here do not represent definitive profitability for individual projects. Rather, they provide an indicative comparison based on the following framework:
- A uniform off-take price is assumed for all projects.
- Technical specifications and site conditions are based on publicly available information.
- The primary objective is the relative positioning of IRR and LCOE.
Therefore, this analysis does not aim to “rank” projects or declare “winners and losers.”
Common Analytical Assumptions
To isolate the impact of site and structural conditions, we have applied the following uniform parameters to all projects:
- Operational Period: 30 years
- Weighted Average Cost of Capital (WACC): 3.0%
- Assumed Off-take Price: 30 JPY/kWh
- Exchange Rate: 155 USD/JPY
Project-Specific Input Parameters
Conversely, unique parameters have been set for each project to reflect its specific reality:
- Wind Resources: Gross Capacity Factor
- Physical Conditions: Water depth and distance from shore
- Logistics: Distance to the base port, O&M port, and grid connection point
These factors significantly influence both CAPEX and OPEX, defining the project’s position on the LCOE and IRR axes.
Note: Specific parameters for each site (depth, distances, etc.) are managed on individual project summary pages.
▶ Promotion Zones List (with individual article links)
| Sea Area | Capacity | Turbines | Technology | Details |
|---|---|---|---|---|
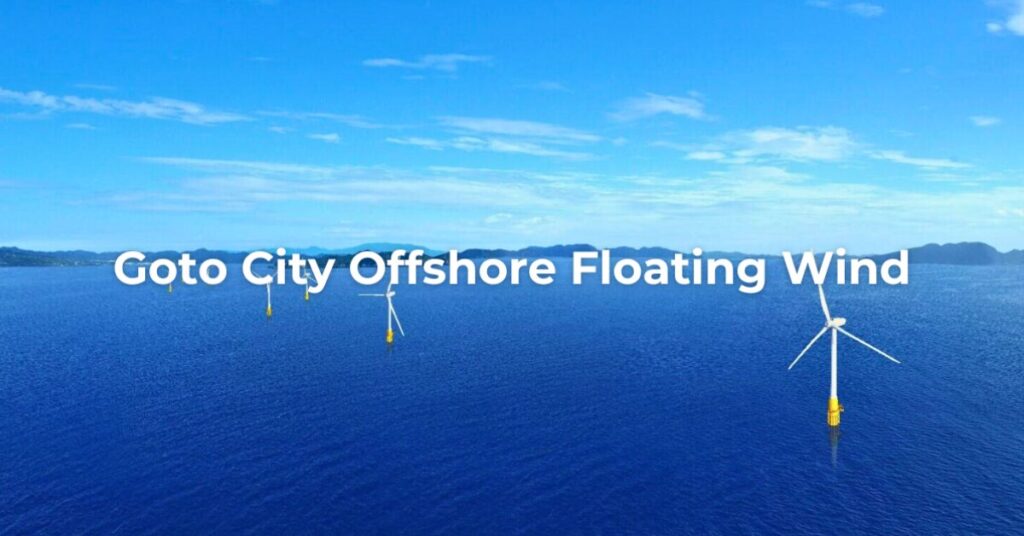
| Goto, Nagasaki | 16.8MW | 8 | Floating | Read more |
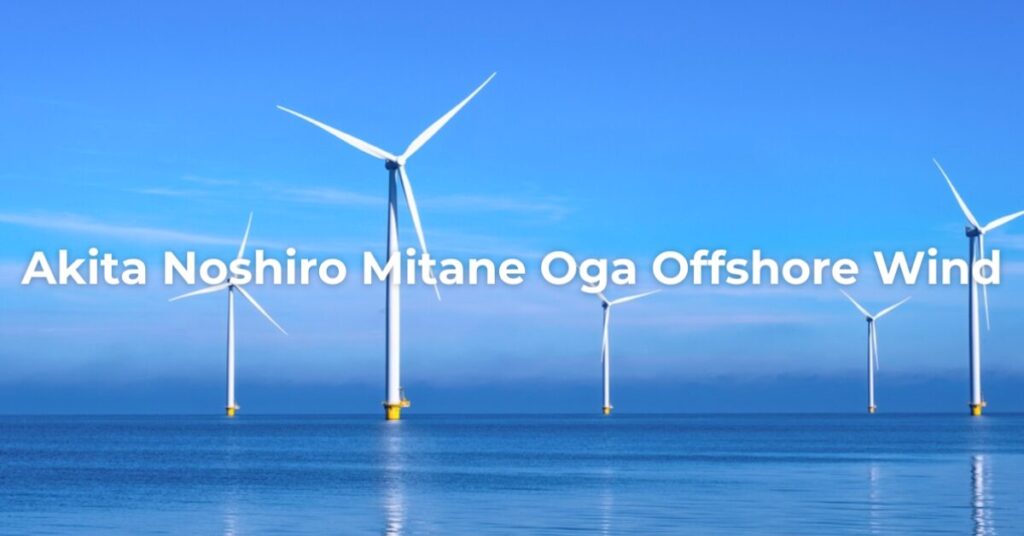
| Noshiro/Mitane/Oga, Akita | 495MW | 33 (estimated) | Fixed-bottom | Read more |
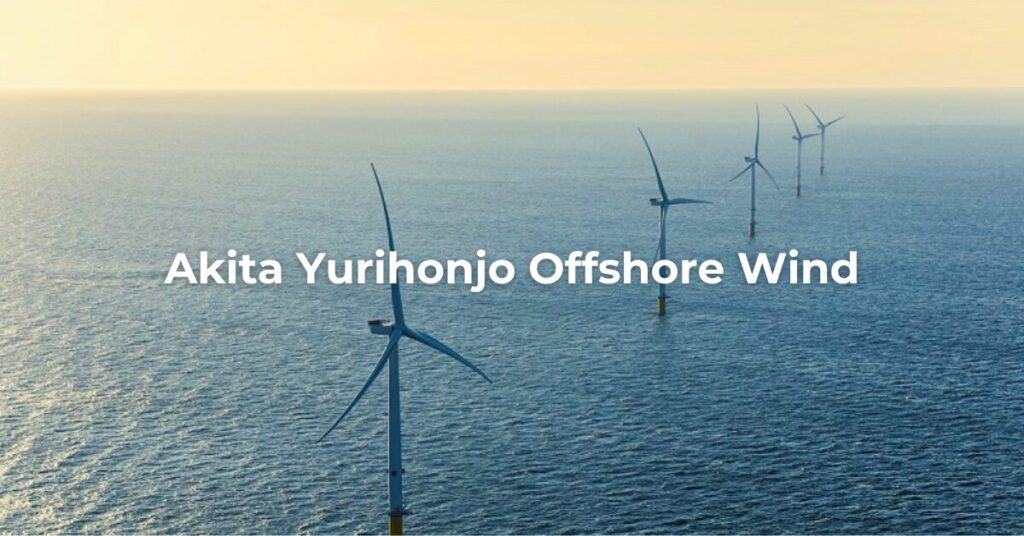
| Yurihonjo, Akita | 840MW | 56 (estimated) | Fixed-bottom | Read more |
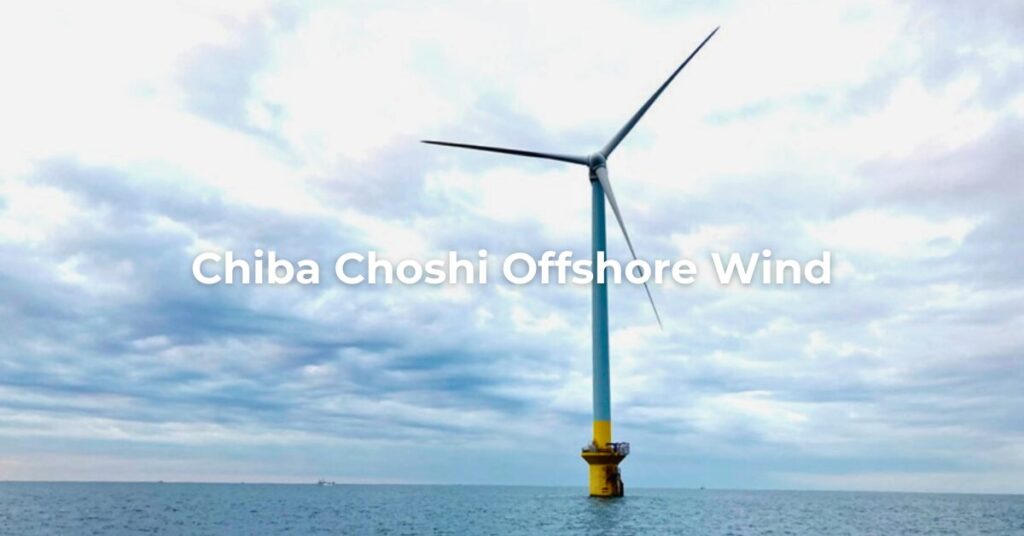
| Choshi, Chiba | 390MW | 26 (estimated) | Fixed-bottom | Read more |
| Happo/Noshiro, Akita | 375MW | 25 | Fixed-bottom | Read more |
| Oga/Katagami/Akita, Akita | 315MW | 21 | Fixed-bottom | Read more |
| Murakami/Tainai, Niigata | 690MW | 38 | Fixed‑bottom | Read more |
| Saikai/Enoshima, Nagasaki | 420MW | 28 | Fixed-bottom | Read more |
| Yusa, Yamagata | 450MW | 30 | Fixed-bottom | Read more |
| Tsugaru, Aomori | 615MW | 41 | Fixed-bottom | Read more |
| Hokkaido Hiyama | 910–1,140MW | 76 (estimated) | Fixed-bottom | Read more |
| Hokkaido Matsumae | 315–320MW | 21 (estimated) | Fixed-bottom | Read more |
3. Relative Comparison: IRR vs. LCOE
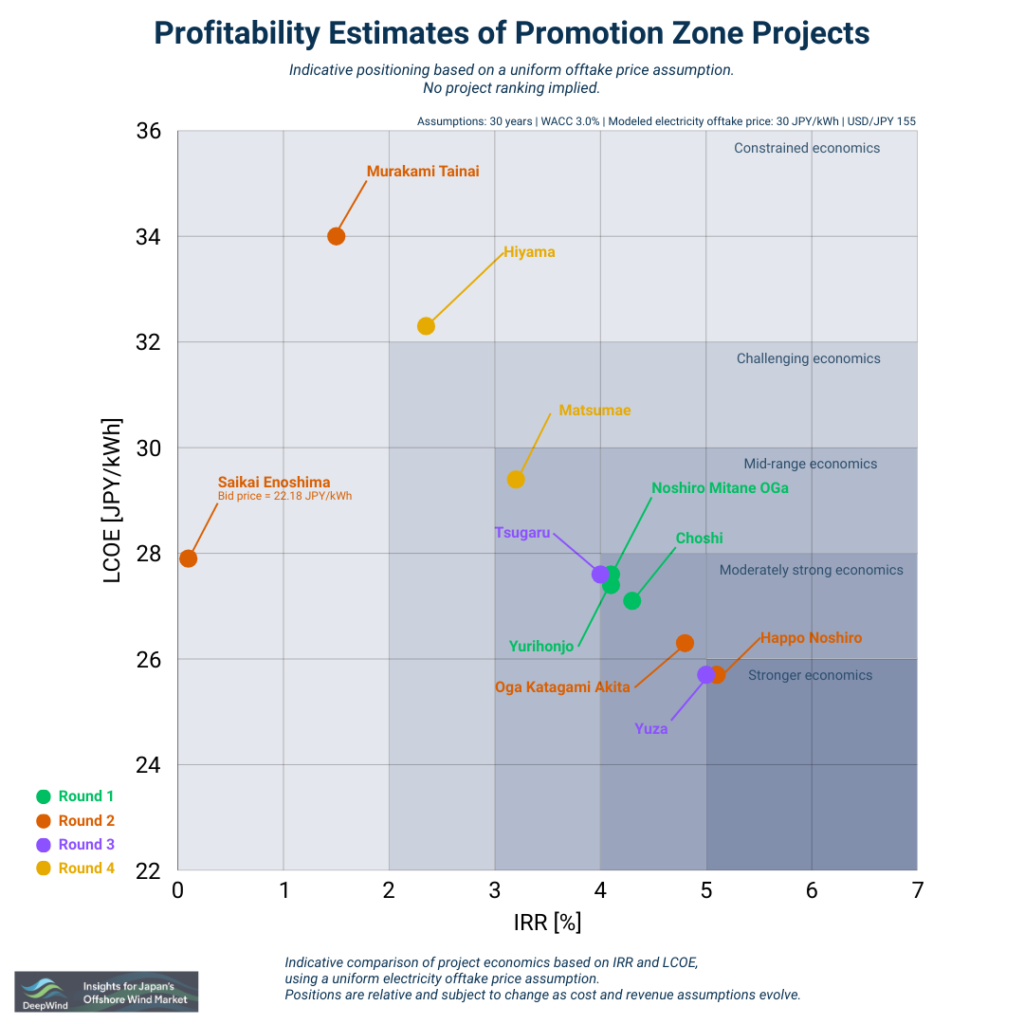
This chart organizes promotion zone projects along two axes:
- Horizontal Axis: IRR (Internal Rate of Return)
- Vertical Axis: LCOE (Levelized Cost of Energy)
Why evaluate both IRR and LCOE?
While LCOE is an effective indicator of power generation efficiency, it does not directly reflect:
- The timing of initial investment recovery.
- Financing conditions and risk premiums.
- Resilience to unexpected cost overruns.
IRR, on the other hand, demonstrates the viability of a project as an investment. In the Japanese market, we have seen cases where projects with competitive LCOEs struggle to secure a sufficient IRR. Thus, we focus on the relationship between the two.
4. Structural Trends in Project Bankability
Note: Goto (Floating) and Saikai-Enoshima are treated as outliers as they are calculated based on specific bid prices and are not suitable for side-by-side comparison with other fixed-bottom projects.
Excluding these outliers, Japanese fixed-bottom projects show a clear bifurcation in terms of bankability.
1. Characteristics of “Top Runner” Projects
Projects in Akita and Yamagata often fall into the “Strong Economics” zone (High IRR / Low LCOE). Their success is driven by a combination of:
- Robust Wind Resources: High capacity factors provide a solid revenue base, acting as a “ceiling” for potential IRR.
- Favorable Construction Conditions: Relatively shallow waters allow for rational foundation designs, suppressing CAPEX.
- O&M Proximity: Short distances to O&M ports reduce long-term OPEX.
2. Constraints in “Challenging” Projects
Projects in Niigata and Hokkaido often face “Constrained Economics” due to:
- Long Grid Connection Distances: Extensive onshore transmission lines structurally inflate CAPEX.
- Logistical Hurdles: Distance from both base and O&M ports adds cost and risk throughout the project lifecycle.
- Unbalanced Cost-Potential Ratio: Even in high-wind areas, the infrastructure costs can be so high that LCOE remains stuck in the 30 JPY/kWh range.
3. Evolution Across Auction Rounds
Rounds 1–2: Concentrated in areas with favorable conditions, with IRRs around 4% and LCOEs between 26–28 JPY/kWh.
Rounds 3–4: While some (like Yuza) achieve high efficiency, others (like Hokkaido) mark a transition into more geographically demanding regions. This illustrates the market’s shift from “low-hanging fruit” to more challenging environments.
5. Summary: What Defines Bankability?
This analysis reaffirms that bankability in Japan’s offshore wind market depends less on specific technology and more on the synergy between site conditions and infrastructure:
- Wind Resource (Revenue potential)
- Access to Grid and Ports (Cost structure)
- Feasibility of Construction and O&M (Risk management)
To expand the market and bring LCOE down to the high 20s while maintaining a sustainable IRR, the industry must design cost structures that realistically account for these infrastructure constraints.
The comparative positioning shown here reflects standardized assumptions.
How these positions shift under execution delays, cost volatility, and financing stress is examined separately.
Round 4 Is Not a Reset.📘 DeepWind Premium Report
A concise, decision-oriented structural brief on what actually changed —
and what remains structurally broken.
- 🔍Market Insights – Understand the latest trends and key topics in Japan’s offshore wind market
- 🏛️Policy & Regulations – Explore Japan’s legal frameworks, auction systems, and designated promotion zones.
- 🌊Projects – Get an overview of offshore wind projects across Japan’s coastal regions.
- 🛠️Technology & Innovation – Discover the latest technologies and innovations shaping Japan’s offshore wind sector.
- 💡Cost Analysis – Dive into Japan-specific LCOE insights and offshore wind cost structures.