Published: October 1, 2026 | Updated: October 7, 2026
COST & COMMERCIAL VIABILITY
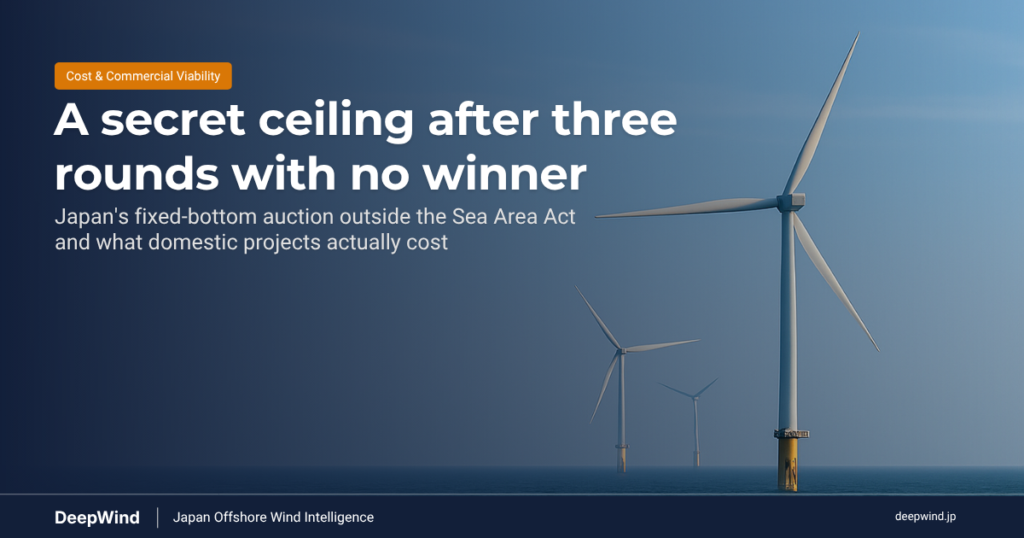
Japan opens its fourth FIT/FIP auction for fixed-bottom offshore wind outside the Renewable Sea Area Act, such as port-area projects, on 13 October 2026. The Act was renamed in Japanese in April 2026; this article keeps its familiar English name. The volume is 190 MW, and the ceiling price stays secret until the bids are opened. The three previous rounds produced no winner. On 25 September the government published cost data from four commercial offshore wind projects already operating in Japan. Their capital cost averages ¥779,000/kW, 38% above the ¥565,000 assumption shown in the same paper. How much of that gap the ceiling absorbs is the variable to watch. The first public evidence arrives with the results on 2 November.
👉 Offshore Wind Cost Structure and Economics: A Structural Guide for Japan
→
Execution Reality
→
Bankability Test
In Round 2 (FY2023) one business plan qualified and still no bid followed. In Round 3 (FY2024) not a single business plan was filed. The FY2025 round was postponed for the same reason: no plans.
Capital cost runs at 1.38 times the assumption and O&M at 1.6 times. The capacity factor averages 27.7% against 30.0%. Spread over 20 years of output, the cost gap alone equals roughly ¥10/kWh (DeepWind simple estimate).
The size of that adjustment is not disclosed. The ceiling published after opening, read together with the bid count, is the first indication of how far the government has moved toward domestic costs.
Three Rounds, Zero Winners (FY2020 to FY2024)
This auction runs inside Japan’s FIT/FIP scheme, the support system that pays generators either a fixed tariff or a premium on top of the market price. It sits outside the Renewable Sea Area Act, the law under which the government designates offshore zones and selects one developer per zone. Projects in port areas fall into this outside-the-Act category. Fixed-bottom means the turbine foundation stands directly on the seabed.
Why does a separate track exist? Japan governs sea use by area. The Renewable Sea Area Act, in force since April 2019, first covered general sea areas outside ports and, from April 2026, the exclusive economic zone (EEZ) as well. Under it the government designates a zone, and one tender picks the developer and sets the supply price together. Port areas are managed by port authorities under the Port and Harbour Act. Since July 2016 that law has allowed port authorities to select occupants by public tender, and a 2019 amendment, in force from February 2020, extended the approval period from 20 to 30 years. A port-area project secures its site through that process and seeks price support separately through FIT/FIP. This auction decides only the price side.
A note on names. The Renewable Sea Area Act tenders run in numbered rounds too, and the next one is also called Round 4. This article covers only the separate FIT/FIP auction for projects outside the Act.
Before auctions, this category ran on fixed tariffs set by the government: ¥36/kWh from FY2014 to FY2019, ¥32 in FY2021 and ¥29 in FY2022. One auction was held in FY2020, and auctions became the rule again from FY2023. All seven offshore wind projects outside the Act operating by March 2026, 468 MW in total, were certified under those fixed tariffs. No auction has yet produced a single award.
| Round (fiscal year) | Volume | Ceiling | Business plans | Bids | Awards |
|---|---|---|---|---|---|
| 1 (FY2020) | 120 MW | ¥34.0/kWh | 1 | 1 (4.8 MW) | 0 |
| 2 (FY2023) | 190 MW | ¥24.0/kWh | 1 (165 MW) | 0 | 0 |
| 3 (FY2024) | 190 MW | ¥24.0/kWh | 0 | 0 | 0 |
| 4 (planned FY2025) | 190 MW | (not run) | 0 | Postponed | |
Round 1 received one bid, reportedly above the ceiling, so no award was made. In Round 2 one 165 MW business plan passed screening and became eligible to bid. No bid was submitted. In Round 3 the process stopped at the first gate.
The FY2025 round was scheduled to open on 14 October 2025. The government postponed it for two stated reasons. It wanted the wider review of the offshore wind business environment settled before fixing a ceiling. And because nobody had filed a business plan, a delay would disadvantage no one. For the current round, business plans closed on 18 September 2026. The count will not be published until 2 November.
Domestic Costs Came In 38% Above the Assumption on Capex and 60% on O&M
The new element in the 25 September paper is data from the periodic reports that FIT/FIP-certified generators file on the costs they actually incurred. For offshore wind, six reports each were received for capital cost and O&M.
| Item | Assumption | Reported | Difference |
|---|---|---|---|
| Capital cost (build to commercial operation) | ¥565,000/kW | ¥779,000/kW (4 commercial projects) | +38% |
| O&M (annual inspection, maintenance, etc.) | ¥22,500/kW/yr | ¥36,000/kW/yr (4 commercial projects) | +60% |
| Capacity factor | 30.0% | 27.7% (6 projects) | −2.3 points |
Two of the six capital cost reports are demonstration units, which average ¥2,056,000/kW. The paper separates them from the four commercial projects, and so does this article. The capacity factor is the share of output a turbine delivers compared with running at full rated power all year. That figure is a six-project average and still includes the two demonstration units.
Two caveats apply. The paper does not name the four projects. And most of Japan’s operating offshore wind sits inside port areas, which likely differ from future projects in scale and turbine size. Larger turbines generally push cost per kW down. Even so, no reported average came in below its assumption.
Converting the gap to a per-kWh figure shows its size. The ¥214,000/kW capex gap, divided by 20 years of output at a 27.7% capacity factor (about 48,500 kWh per kW), is roughly ¥4.4/kWh. The ¥13,500/kW/yr O&M gap, divided by annual output, is about ¥5.6/kWh. Together that is close to ¥10/kWh. This is simple division with no discounting and no interest cost, so the true gap is larger (DeepWind simple estimate). A lender building a debt case at the same tariff can reach different conclusions depending on which cost base it uses.
How Is This Auction’s Ceiling Set?
The paper restates the four-step method used in earlier rounds. First, the average natural conditions of candidate sites go into the fixed-bottom cost formula compiled by NEDO, Japan’s state research and development agency. Second, the resulting capital, O&M and decommissioning costs are adjusted for the price gap between Japan and overseas markets. Third, grid connection costs outside the formula are added. Fourth, an appropriate IRR, the rate of return the project earns, is added.
The second step carries the weight. NEDO built the formula on the premise that Japan has European-level ports and supply chains. The paper states plainly that the formula does not reflect price differences between Japan and overseas. The FY2025 update added cost-escalation correction factors and current exchange rates. The European-level premise remains.
So the distance between the formula and domestic reality closes only through that adjustment, and the adjustment is as undisclosed as the ceiling. The same paper also cites a 68% fall in global offshore wind LCOE between 2014 and 2024, from 274 to 87 USD/MWh (BloombergNEF, including floating wind). That is the world the formula looks at.
Two Reference Points: “Around ¥30/kWh” and ¥24/kWh
The paper carries two reference points for reading the ceiling.
The first is a guidepost set by the government’s offshore wind working group in July 2026. It proposed prioritising project development in sea areas where generation cost stays at around ¥30/kWh or below. Two figures supported it: a ¥30.9/kWh cost estimate for offshore wind built in 2023, and the Japan Wind Power Association’s (JWPA) statement that business cost averages in the mid-¥30s per kWh. The JWPA number comes from a survey of five fixed-bottom projects in general sea areas. It includes a 6% project IRR, the return on the project before debt effects. That guidepost covers offshore wind development as a whole. The ceiling for this auction is decided separately, on the committee’s advice, before bidding opens.
The second is the ¥24/kWh ceiling of the last two rounds. At that level, even the round with a qualified plan produced no bid.
This auction also carries a risk the Act-based tenders do not. The paper notes that Act-based tenders come with a 30-year occupancy permit and more predictable conditions, while this auction is not tied to a specific sea area. Port-area approvals can also run 30 years, but the site process and the price auction move separately, so securing one says nothing about the other. On that count, developers outside the Act likely carry more uncertainty.
The committee’s own debate has moved too. The chair’s summary of the July meeting records members asking whether FIT/FIP support is still the right instrument for offshore wind at all.
What to Read on 2 November
Bidding runs from 13 to 26 October, and results come out on 2 November with the ceiling published alongside. Three numbers matter.
1. Business plans filed. Zero means the round stopped at the first gate again, as in Round 3 and FY2025.
2. Bids submitted. Plans without bids repeat Round 2. With the ceiling secret, developers compare their own costs with the level they expect.
3. The ceiling itself. Did it move from ¥24, and by how much? The paper does not state how the ¥565,000 assumption relates to the ceiling calculation, so the reported cost gap cannot simply be added on. A move away from a level that twice failed to attract a bid is informative on its own.
Together, the three numbers will show from the outside, for the first time, whether the government is prepared to price domestic costs.
This auction tests whether the government will accept Japan’s actual costs. It is not testing developers’ price competitiveness.
Competitive bidding exists to push cost down. The last three rounds stopped before any price competition began. In Round 2 an eligible plan existed and no bid came. Developers appear to have measured the distance between the likely ceiling and their own costs, and stepped back before bidding.
The 25 September paper put part of that distance on the public record for the first time: ¥214,000/kW on capital cost and ¥13,500/kW a year on O&M. The ceiling formula assumes European-level conditions and relies on an adjustment to reach Japan. The open question is how much of the new domestic data that adjustment now carries.
Developers and EPC contractors should treat this number as more than a 190 MW footnote. Consider it the first published signal of whether Japan is ready to price domestic offshore wind costs. Exercise caution, though, before reading a single ceiling as a settled policy line.
Related DeepWind Articles
- Offshore Wind Cost in Japan: CAPEX, OPEX and LCOE Explained
- Japan FIT vs FIP: How Offshore Wind Revenue Actually Works
- Cost Realities of Japan’s Offshore Wind: LCOE and IRR Across 12 Promotion Zones
- Japan’s LTDA Explained: How the Long-Term Decarbonization Auction Works
- Offshore Wind Disadvantages in Japan: Costs 38% Above Plan and Three Other Risks (2026)
DeepWind Weekly tracks Japan’s offshore wind market beyond headline announcements, focusing on execution risk, cost structure, project viability, supply-chain constraints, and policy implications.
Subscribe to receive weekly intelligence on Japan’s offshore wind market.
Why Isn't Floating Wind Bankable in Japan Yet?
The synchronized supply-chain bottleneck, quantified node by node, with a full sensitivity ranking and a bankability ladder of scaling conditions. Includes Simulator Professional (β) access to reproduce every figure on your own assumptions.
See the full analysis →