Published: February 14, 2026 | Updated: February 14, 2026
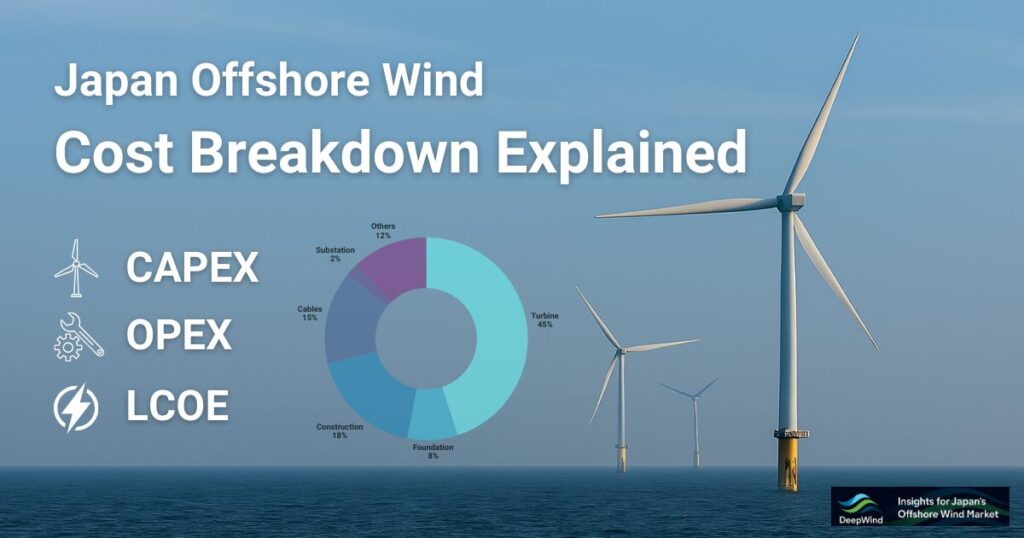
Japan offshore wind cost remains significantly higher than in mature European markets. Understanding the cost breakdown—including CAPEX, OPEX, transmission, and levelized cost of energy (LCOE)—is essential for evaluating project feasibility and long-term competitiveness.
This article explains the structure of offshore wind costs in Japan, highlights the key cost drivers, and clarifies how project economics are shaped by water depth, supply chain constraints, port infrastructure, and grid connection conditions.
While this article focuses on a specific cost-related aspect, we recommend this summary article for a comprehensive overview of offshore wind cost structure and economic outlook:
👉 Cost Structure and Economics of Offshore Wind
1. Japan Offshore Wind Cost Breakdown
Japan offshore wind cost is structurally higher than in many mature European markets. As of 2025, total capital expenditure (CAPEX) is commonly cited at around JPY 900,000 per kW based on industry surveys, while overall levelized cost of energy (LCOE) remains roughly double European levels. To understand why, it is essential to break down the cost structure into its core components.
Offshore wind project economics in Japan are primarily driven by three major cost categories:
- Capital Expenditure (CAPEX) – Turbines, foundations, installation vessels, offshore substations, subsea cables (array and export), onshore substations, and grid connection infrastructure.
- Operational Expenditure (OPEX) – Turbine maintenance, marine logistics, insurance, and balance-of-plant services over a 20–30 year project lifetime.
Among these components, installation and turbine procurement typically account for the largest share of upfront CAPEX, while marine access constraints and weather-related downtime increase long-term OPEX compared to many European projects. In addition, Japan’s grid-connection model requires developers to initially finance export infrastructure, adding further capital intensity.
Understanding this breakdown is critical when assessing offshore wind feasibility in Japan. While policy targets anticipate significant cost reductions toward 2040, today’s economics remain heavily influenced by structural factors such as deeper waters, typhoon-resistant design requirements, limited domestic supply-chain capacity, and smaller project scale.
2. CAPEX Structure of Offshore Wind in Japan
Japan’s offshore wind farms comprise several key components — turbines, foundations, subsea cables, offshore substations, and installation work — with total capital expenditure (CAPEX) estimated at JPY 900,000 per kW as the survey result by JWPA as of Nov. 2025, roughly twice the cost level observed in Europe.
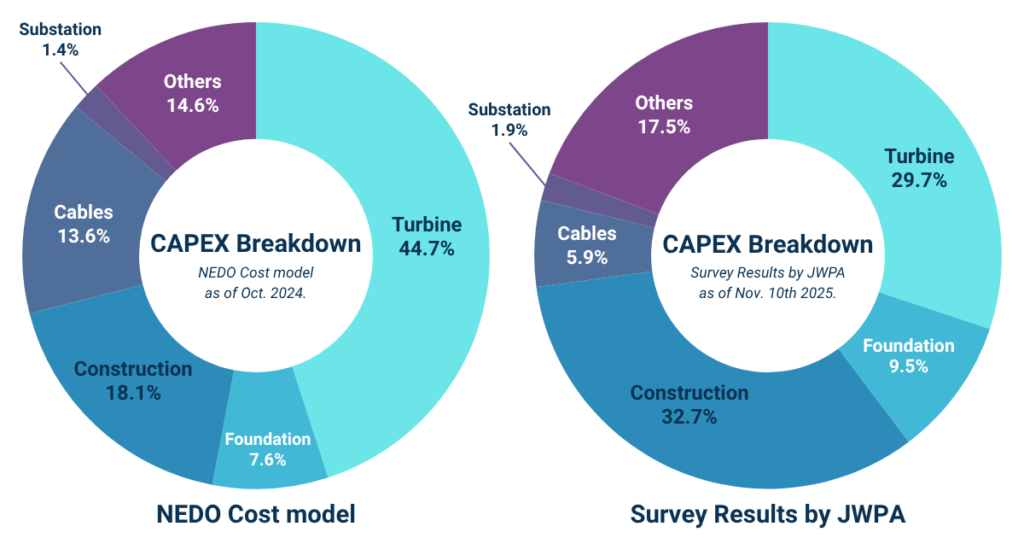
The typical breakdown of initial CAPEX for a monopile foundation project is as follows. (as of Nov. 2025.)
- Turbines: 30%
- Foundations: 10%
- Installation: 33%
- Cables: 6%
- Substation: 2%
- Others: 19%
Among these, installation costs for the largest share (33%), followed by turbine procurement accounts (30%).
Japan’s higher CAPEX compared to overseas markets is generally attributed to the following factors:
Key cost drivers:
- Severe marine conditions requiring designs resistant to typhoons and high waves
- Limited domestic supply chain for large turbines, vessels, and components, leading to import dependence
- With a large number of small-scale projects, achieving economies of scale remains difficult.
Recent Cost Divergence: NEDO (2024) vs JWPA (2025)
Recent public estimates highlight a widening gap in reported offshore wind CAPEX levels in Japan. In October 2024, NEDO published cost projections based on assumed industrial-scale deployment and gradual supply-chain maturation. However, a survey conducted by the Japan Wind Power Association (JWPA) in November 2025 indicated significantly higher actual cost levels for ongoing projects.
The divergence between these estimates can be attributed to several structural and macroeconomic factors:
- Material cost inflation, particularly for steel and marine construction components
- Rising labor and vessel charter costs amid limited domestic installation capacity
- Exchange rate volatility, especially yen depreciation affecting imported turbines and components
- Supply-chain bottlenecks during global offshore wind expansion
While long-term policy targets assume cost reductions toward 2040, current market conditions suggest that short- to mid-term project economics remain exposed to global commodity cycles and currency fluctuations. Understanding this dynamic is essential when interpreting headline CAPEX figures.
3. OPEX Structure and O&M Costs in Japan
- O&M Cost
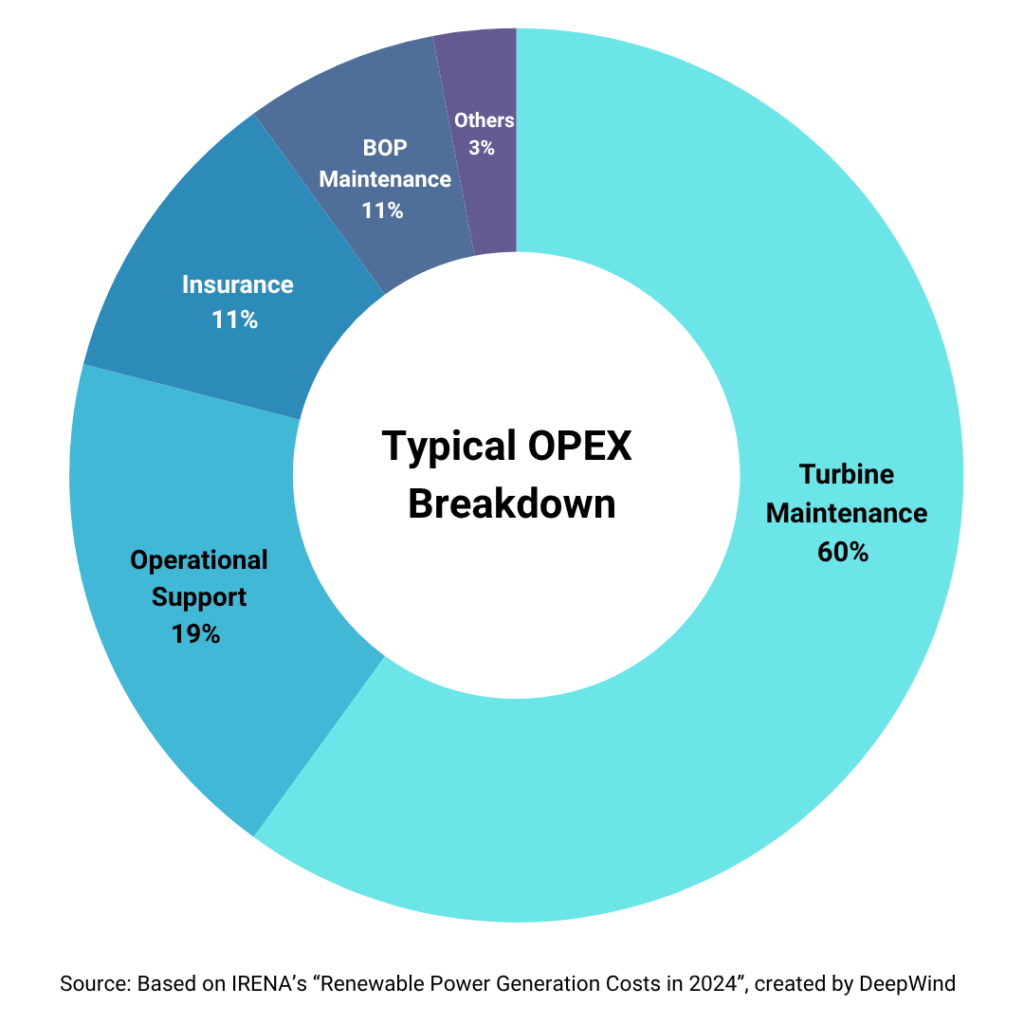
Among these, turbine maintenance typically represents the largest share, accounting for around 60% of total O&M costs. This reflects the need to ensure optimal turbine performance over the project lifetime by regular servicing, repair work and component replacement. Operational support is the second largest cost, accounting for 19% of the total, while insurance costs contribute a further 11%. Balance of plant (BoP) maintenance – which includes marine operations, labour, spare parts, consumables, proactive and reactive O&M and offshore substation O&M – represents around 7%. The remaining 3% falls under “other costs”, which relate to contingencies and expenses associated with wind farm operation (Wood Mackenzie, 2024c). - Floating Wind Premium
Floating turbines face higher O&M costs due to complex access and mooring systems.
4. Grid Connection and Transmission as a Major CAPEX Driver
- Offshore Transmission Cables and Grid Reinforcement
Transmitting power from wind-rich regions such as Hokkaido and Tohoku to major demand centers depends heavily on the development of HVDC (High-Voltage Direct Current) networks.
While HVDC enables long-distance transmission with minimal losses, the associated infrastructure costs are enormous, ultimately affecting grid access fees and consumer electricity prices. - Differences in Institutional Design
In Europe, offshore transmission cables are often installed and financed by transmission system operators (TSOs).
In contrast, Japan adopts a model where project developers build the grid connection at their own expense and later transfer the assets to the TSO. - Offshore Deployment Trends
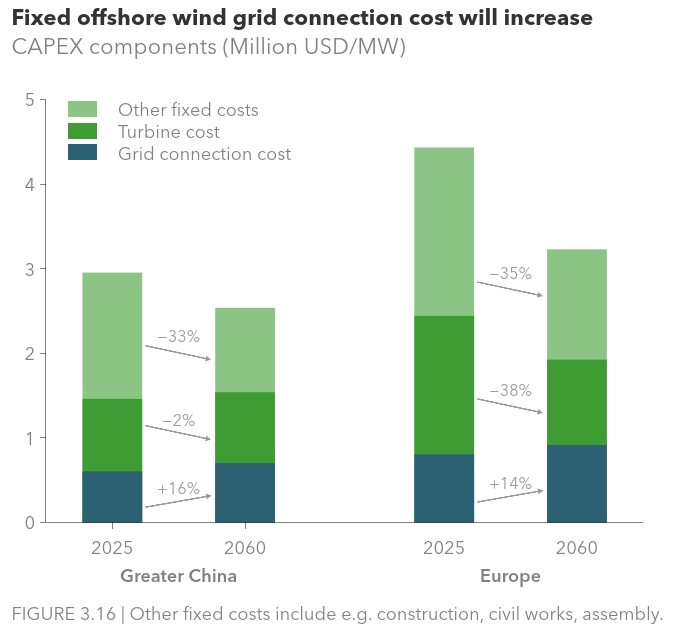
With Japan’s Exclusive Economic Zone (EEZ) now open to floating offshore wind installations, future projects are expected to be located farther from shore, increasing offshore distances.
According to DNV’s Energy Transition Outlook 2025, as wind farms are developed farther offshore, grid connection costs are projected to rise steadily through 2060.
5. LCOE of Offshore Wind in Japan (2023–2040 Outlook)
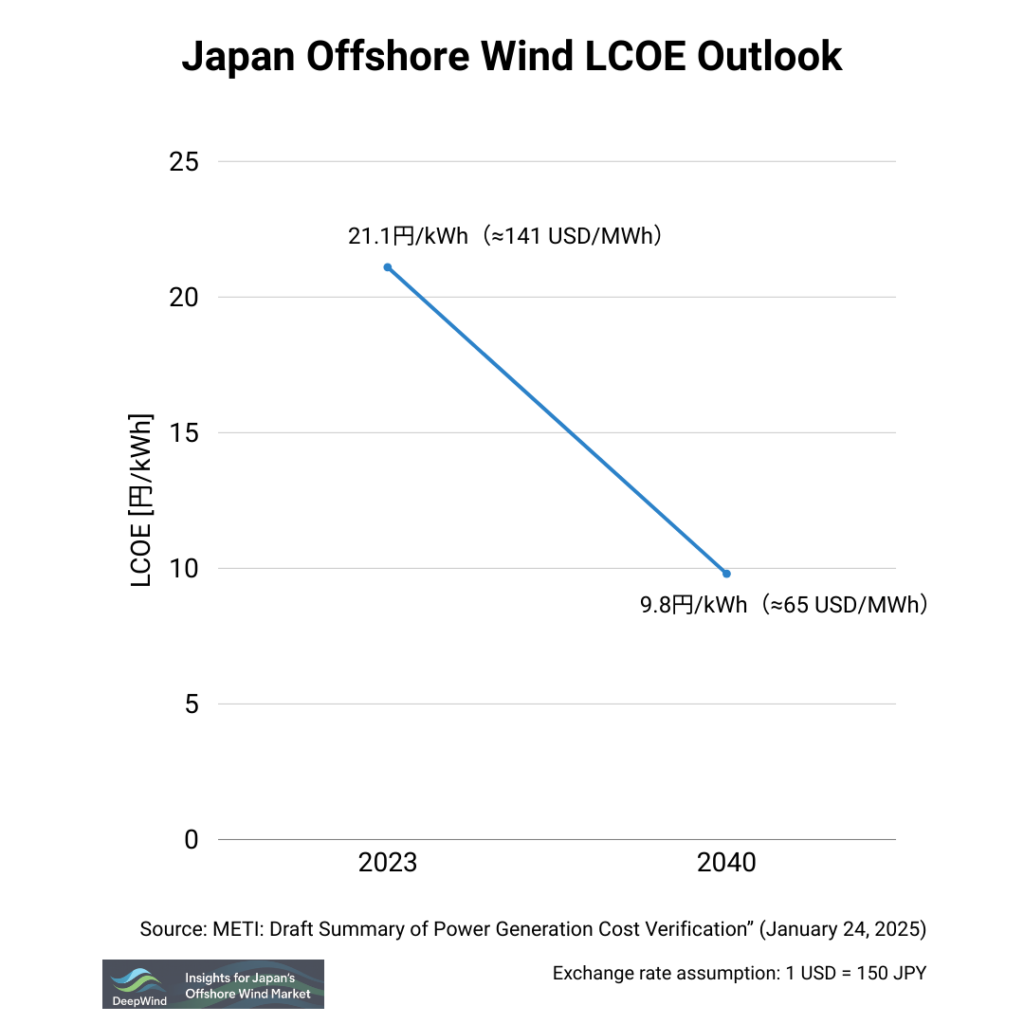
- 2023 Baseline: 21.1 JPY/kWh (pure generation cost)
- 2040 Estimates: 9.5 – 10.1 JPY/kWh
- Cost-Reduction Drivers
- Turbine upscaling (from 13 MW to 15/18 MW+)
- Higher capacity factors (from 30% to ~40%)
- Supply-chain maturity & experience curve effects
While national averages provide a useful reference, project economics in Japan vary significantly by promotion zone. Differences in wind resource, water depth, port distance, and grid connection conditions can materially affect both LCOE and internal rate of return (IRR).
DeepWind has conducted a relative LCOE and IRR comparison across Japan’s designated promotion zones using a standardized cost model. If you would like to see how each zone positions in terms of project economics, see the analysis below:
▶ Promotion Zone LCOE & IRR Comparative Analysis
6. Comparison with Other Renewables
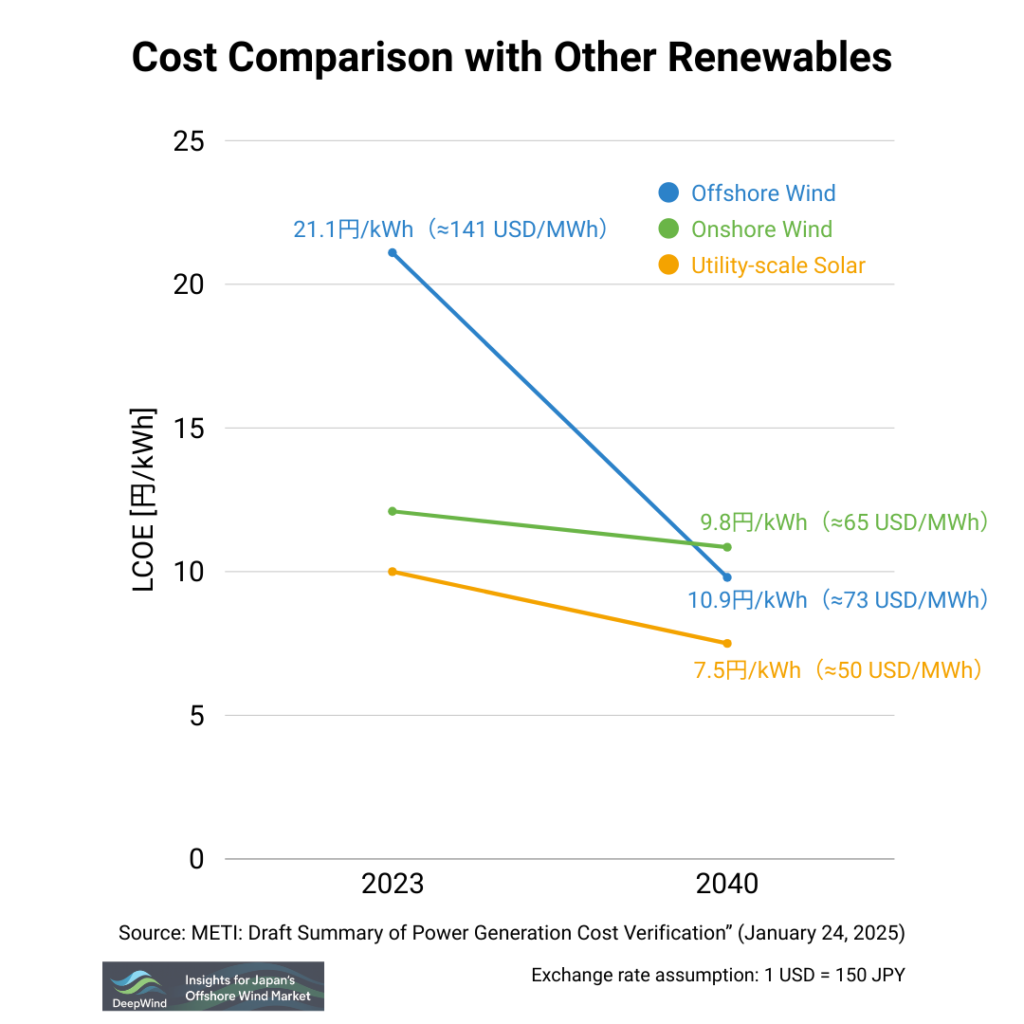
| Technology | 2023 LCOE (unsubsidized) | 2040 Outlook |
|---|---|---|
| Offshore Wind | 21.1 JPY/kWh | 9.5 – 10.1 JPY/kWh |
| Onshore Wind | 12.1 JPY/kWh | 10.1 – 11.6 JPY/kWh |
| Solar PV (Utility) | 10.0 JPY/kWh | 6.6 – 8.4 JPY/kWh |
Solar PV and onshore wind currently offer lower generation costs than offshore wind, though each has unique grid-integration and site-specific challenges.
7. Why Offshore Wind Costs Are Higher in Japan
Japan’s offshore wind projects are currently more expensive than those in Europe. While long-term projections suggest costs could decline significantly by 2040, today’s projects face several structural challenges.
The reasons are not driven by a single issue. Instead, they reflect Japan’s geographic conditions, industrial structure, and market maturity.
1. Harsh Natural Conditions
Typhoons, high waves, and seismic risks require stronger and heavier designs. These additional engineering requirements increase material use and installation complexity.
2. Limited Domestic Supply Chain
Japan still depends heavily on imported turbines, vessels, and major components. Currency fluctuations and limited installation vessel availability have increased overall project costs.
3. Smaller Deployment Scale
Compared to Europe, Japan’s offshore wind market is still in its early scaling phase. Lower annual installation volumes make it harder to achieve economies of scale.
4. Grid and Port Infrastructure
Grid connection and port upgrades require substantial upfront investment. Developers typically bear initial grid costs, which increases capital requirements.
Whether Japan can close the cost gap with Europe will depend on supply-chain localization, larger project volumes, and stable policy implementation.
8. Regional Comparison of Wind Power LCOE
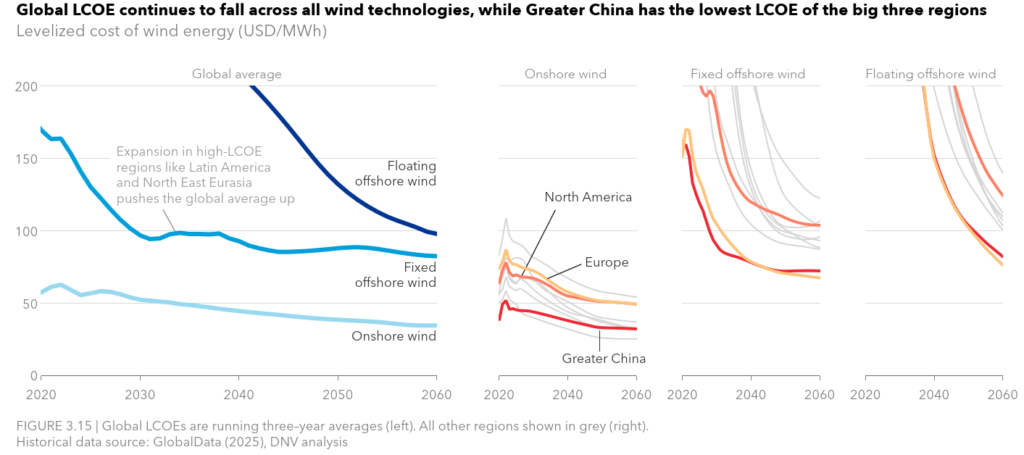
In Mainland China, the LCOE of onshore wind remains significantly lower than in Europe and North America.
This is primarily due to excess manufacturing capacity and intense domestic competition, which have led to artificially low turbine prices—levels that are unlikely to be sustainable in the long term.
In addition, China’s mature supply chain and low land and labor costs further contribute to the country’s low LCOE.
In Europe, the LCOE for fixed-bottom offshore wind is projected to reach parity with China by the late 2030s, before declining further toward 2060.
A similar trend is expected for floating offshore wind, though at a slower pace.
In contrast, North America’s LCOE is forecast to remain higher than other regions, as policy uncertainty and temporary project halts are expected to drive up long-term costs.
(Source: DNV, Energy Transition Outlook 2025)
Comparison with Japan
From the DNV chart, comparing Europe’s LCOE with Japan’s, it can be observed that:
- In 2023, Japan’s offshore wind LCOE was about twice as high as Europe’s.
- By 2040, however, Japan is expected to close the gap, with LCOE falling to the ¥9/kWh range, nearly on par with Europe.
| Region | 2023 | 2040 Outlook |
|---|---|---|
| Europe | ~USD 75/MWh ≈ ¥11.3/kWh | ~USD 60/MWh ≈ ¥9/kWh |
| Japan | ¥21-25/kWh | ¥9.5–10.1/kWh |
9. Policy Targets & Future Outlook
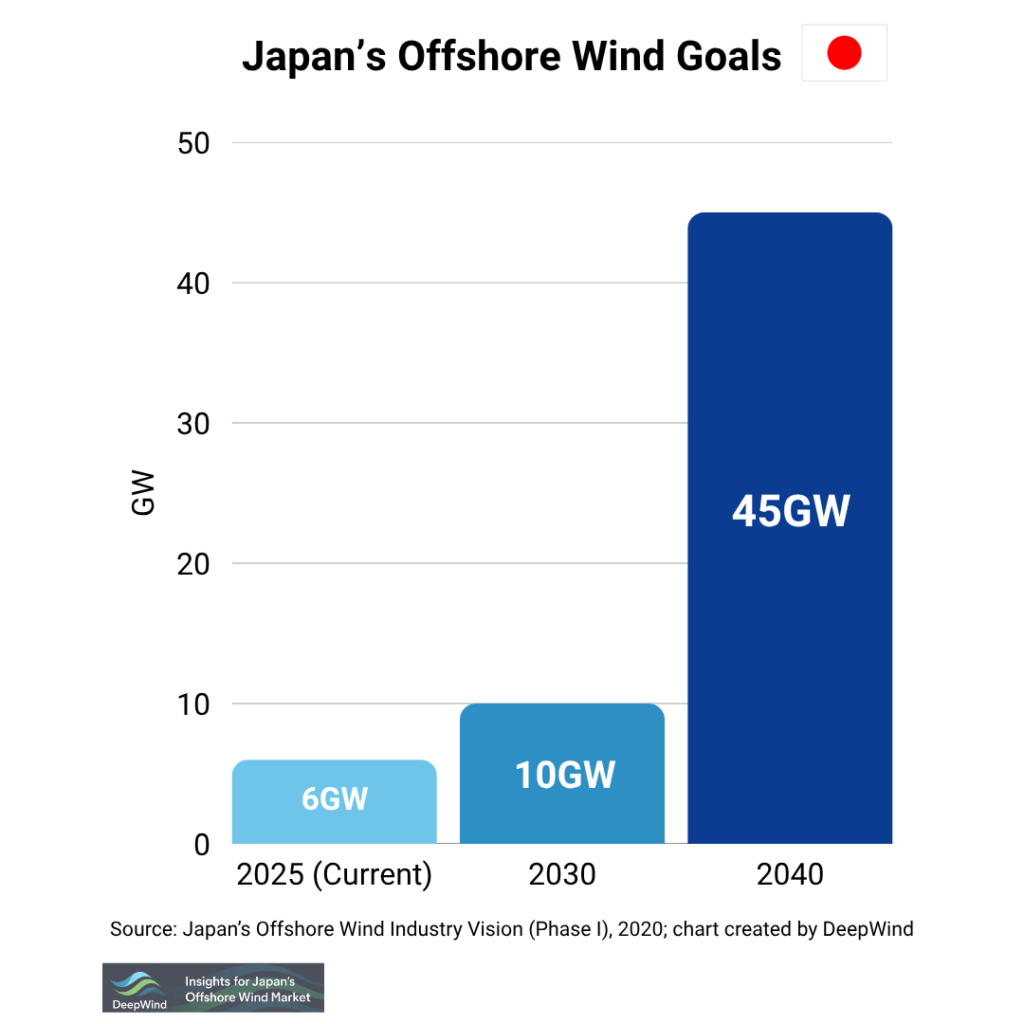
In the First Offshore Wind Industry Vision announced on December 15, 2020, the Japanese government set targets of achieving a cumulative 10 GW by 2030 and 45 GW by 2040.
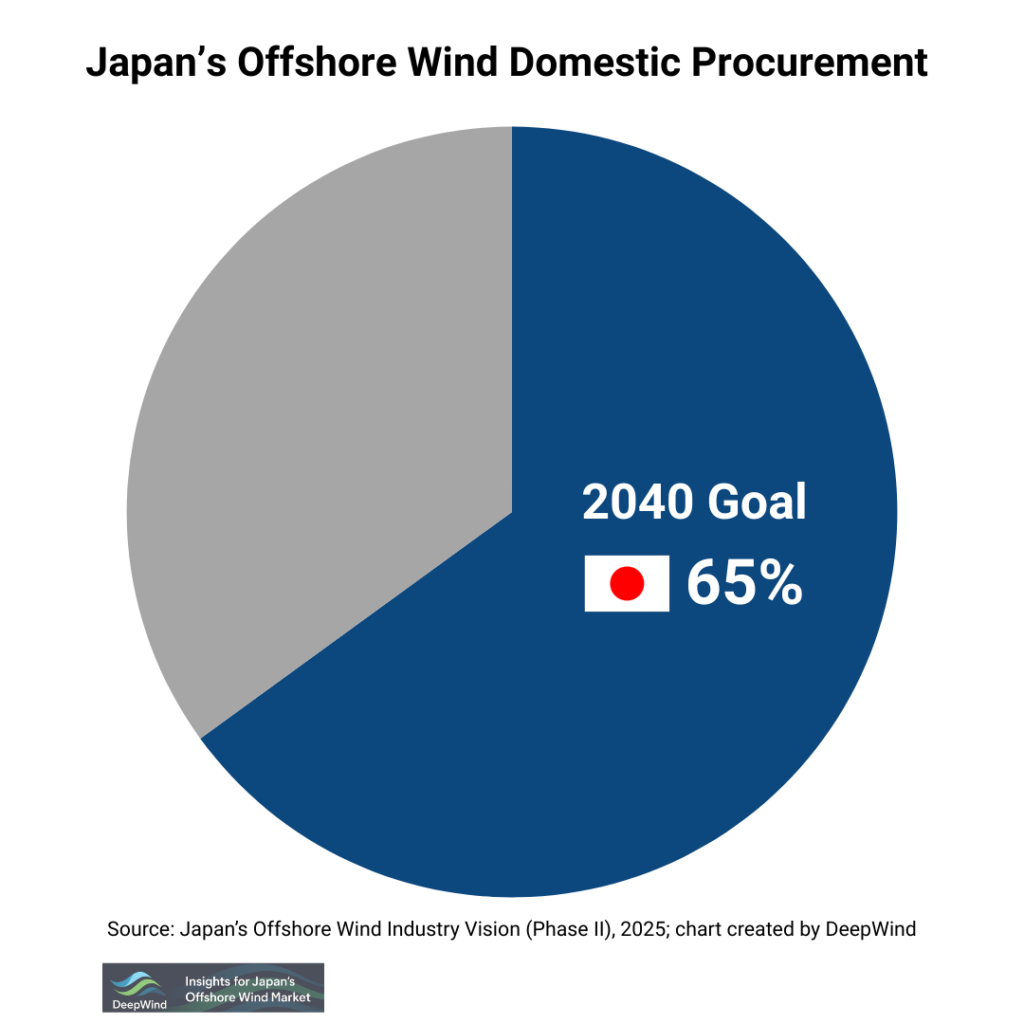
Furthermore, under the Second Offshore Wind Industry Vision (Industrial Strategy for Floating Offshore Wind, etc.) released on August 8, 2025, the government and industry set a goal to form more than 15 GW of floating offshore wind projects by 2024, while also aiming to raise the domestic procurement ratio to over 65% by 2040.
To achieve these targets, Japan will need to simultaneously advance both technical and institutional cost-reduction measures — including the development of domestic manufacturing bases for key turbine components, the enhancement of port and grid infrastructure, and government-led financial support programs.
Conclusion: What Japan’s Offshore Wind Cost Structure Means for Investors
Japan’s offshore wind cost structure remains elevated today, shaped by CAPEX intensity, installation constraints, and grid infrastructure requirements. Long-term projections suggest meaningful cost reductions toward 2040, driven by turbine upscaling, industrial learning effects, and expanded deployment.
However, cost convergence with Europe will ultimately depend on structural factors: supply-chain localization, port and grid readiness, floating wind commercialization, and macroeconomic stability. Offshore wind has the potential to become globally competitive in Japan—but the trajectory will be determined by execution as much as policy ambition.
If you’re interested in a deeper understanding of offshore wind costs—including both fixed-bottom and floating projects—don’t miss our in-depth overview article:
🌊 Cost Structure and Economics of Offshore Wind
Explore more categories at DeepWind:
- 🔍Market Insights – Understand the latest trends and key topics in Japan’s offshore wind market
- 🏛️Policy & Regulations – Explore Japan’s legal frameworks, auction systems, and designated promotion zones.
- 🌊Projects – Get an overview of offshore wind projects across Japan’s coastal regions.
- 🛠️Technology & Innovation – Discover the latest technologies and innovations shaping Japan’s offshore wind sector.
- 💡Cost Analysis – Dive into Japan-specific LCOE insights and offshore wind cost structures.