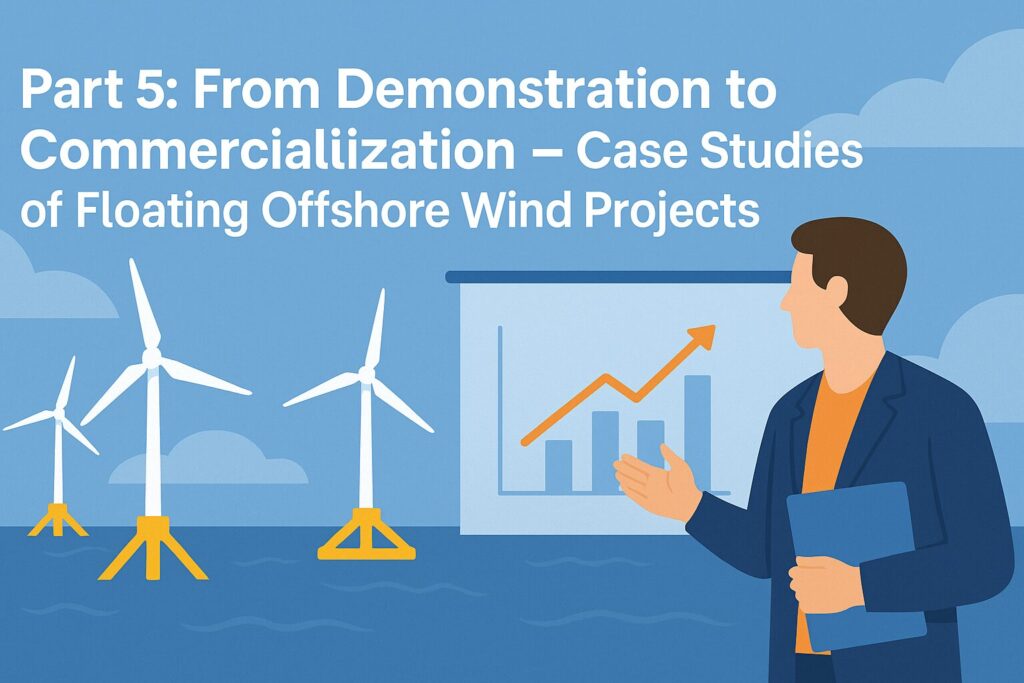
Introduction
In this series, we’ve covered technical fundamentals, platform design, cost structures, and regulatory frameworks for floating offshore wind. Part 5 delves into real-world demonstrations and commercial projects in Japan and abroad. By analyzing performance data, stakeholder engagement, and operational strategies, we extract the success factors and pitfalls of scaling from pilot to full-scale commercialization.
The topics covered in this article are part of a broader analysis examining floating offshore wind from a structural perspective — spanning technology, costs, regulations, and project viability. For a comprehensive overview, see the full guide below.
👉 Floating Offshore Wind in Japan|A Structural Guide to Markets, Costs & Policy
This article takes a deep dive into this specific topic, but if you’re looking for a comprehensive overview of offshore wind technologies, check out our full summary article here:
👉 Offshore Wind Technology 2025: Foundations, Floating Wind, Turbines, and Innovations
1. Japanese Demonstration Projects
1-1. Akita Southern Coast Semi-Submersible (15 MW)
Supported by NEDO’s Green Innovation Fund, the 15 MW semi-submersible demonstration launched in 2023 at ~70 m depth, 30 km offshore. Six months of wave response monitoring confirmed platform motions within ±5° of design under 20 % greater storm wave heights. Real-time mooring tension control maintained safety factors above 3.0 during extreme events. Power output data revealed a capacity factor of 45 %, enabling an LCOE of ~€85/MWh (~¥11/kWh), within 10 % of model predictions.
1-2. Aichi Tahara SPAR Demonstration (12 MW)
The 12 MW SPAR project off Tahara City began operation in early 2024. Advanced mooring tension algorithms, linked to flow meters, reduced line fatigue by 30 % under strong tidal currents. Autonomous ROV inspections provided detailed seabed cable condition assessments, enabling predictive maintenance scheduling and minimizing unscheduled downtime.
1-3. Kitakyushu Hibikinada Commercial Barge Farm (3 MW × 5)
Commercial operations commenced in April 2025. Assembled and tested at a local shipyard, the five 3 MW units were towed without SEP vessels. The farm achieved a 40 % capacity factor and held OPEX to €120k/MW-yr. A “community benefit” model paired fisheries compensation with eco-tourism programs, generating €200k/year in local revenue and fostering strong social license.
2. International Projects
2-1. Hywind Scotland (6 MW × 5)
Operational since 2017, Hywind Scotland set the benchmark with over 55 % capacity factors in the North Sea. A long-term O&M contract fixed OPEX at €140k/MW-yr, enhancing revenue predictability. Structural fatigue tests after 15 years show damage levels below 20 % of design predictions.
2-2. Hywind Tampen (8 MW × 11)
Launched in 2022 off Norway, this 88 MW SPAR farm powers oil platforms. Iterative hull design optimization reduced CAPEX by 20 % and OPEX by 10 %. Integration of AI-driven fault detection cut unplanned downtime to fewer than two events annually.
2-3. Kincardine (9.5 MW × 5)
Online since 2021, Kincardine’s semi-submersibles used multi-hazard dynamic modeling to trim excessive safety margins, reducing CAPEX by 15 %. O&M is managed from Aberdeen, with optimized maintenance base logistics cutting response times by 30 %.
3. Success & Failure Analysis
- Success Factors:
• Long-term policy support and subsidies
• Early stakeholder engagement and benefit-sharing
• Standardized predictive maintenance protocols
• Phased environmental monitoring and adaptive management
• Revenue stabilization via energy demand integration (e.g., oil & gas platforms) - Failure Factors:
• Permitting delays and cost overruns
• Underestimated extreme weather loading leading to damage
• Mooring line fatigue and unplanned cable failures
• Insufficient community consultation, leading to legal challenges
• Commodity price shocks in key materials
Conclusion & What’s Next
These case studies reveal that commercial success hinges not only on engineering but on policy alignment, supply chain resilience, and proactive stakeholder collaboration. Japan must adapt solutions to its EEZ opportunities, typhoon and seismic hazards, and regional port constraints. Part 6 will examine future technological trends—next-gen turbines, hybrid platforms, and digital twins—to 2030 and beyond.
The topics covered in this article are part of a broader analysis examining floating offshore wind from a structural perspective — spanning technology, costs, regulations, and project viability. For a comprehensive overview, see the full guide below.
👉 Floating Offshore Wind in Japan|A Structural Guide to Markets, Costs & Policy
For a broader look at offshore wind technologies and future innovations, make sure to explore our comprehensive summary article:
🌊 Offshore Wind Technology 2025: Foundations, Floating Wind, Turbines, and Innovations
Round 4 Is Not a Reset.📘 DeepWind Premium Report
A concise, decision-oriented structural brief on what actually changed —
and what remains structurally broken.
- 🔍Market Insights – Understand the latest trends and key topics in Japan’s offshore wind market
- 🏛️Policy & Regulations – Explore Japan’s legal frameworks, auction systems, and designated promotion zones.
- 🌊Projects – Get an overview of offshore wind projects across Japan’s coastal regions.
- 🛠️Technology & Innovation – Discover the latest technologies and innovations shaping Japan’s offshore wind sector.
- 💡Cost Analysis – Dive into Japan-specific LCOE insights and offshore wind cost structures.