Introduction
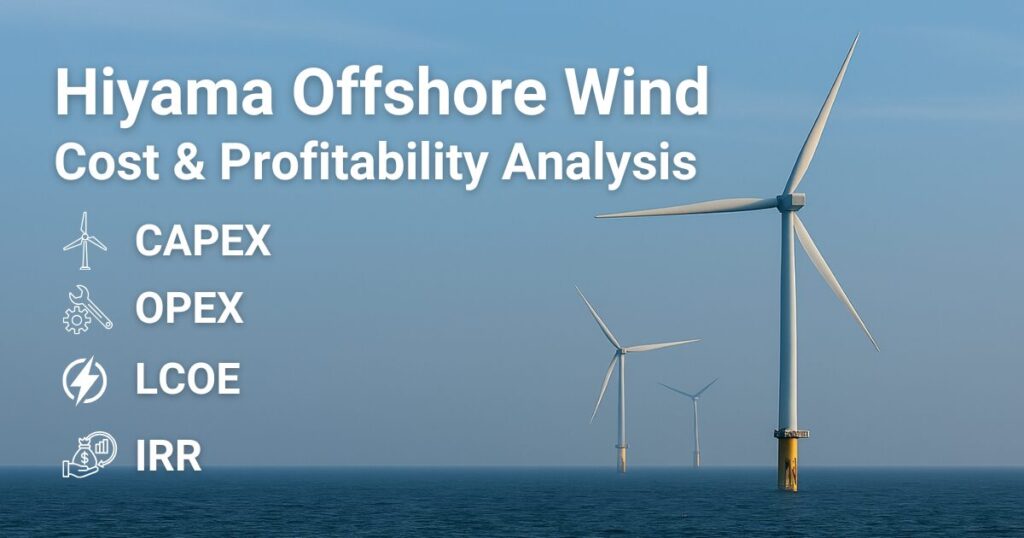
Evaluating the profitability of offshore wind projects requires close attention to cost-related indicators such as CAPEX, OPEX, LCOE, and IRR.
However, in Japan’s designated Promotion Zones, publicly available cost data remain scarce, leaving investors and developers with limited information for decision-making.
In this article, we assess the Hokkaido Hiyama Offshore Wind Project, estimating CAPEX, OPEX, LCOE, and IRR using on DeepWind’s proprietary cost model which references the NEDO cost model and international benchmarks, based on representative site conditions including distance to shore, water depth, and distance to port.
While these figures are independent estimates, they provide useful insights into the characteristics of this zone and a basis for relative comparison with other areas.
This article focuses not on project progress or policy background, but on the cost analysis. If you would like to learn more about the project overview of the Hokkaido Hiyama Offshore Wind project, please see the article below.
👉 Hokkaido Hiyama Offshore Wind Power Project
| Revision History |
| Nov. 2025: Updated CAPEX&OPEX model and LCOE&IRR recalculation. |
Note: This article presents an indicative analysis based on the cost model and assumptions available at the time of writing.
For the latest cost assumptions and updated relative positioning of projects, please refer to the following Pillar article.
👉 Cost Realities of Japan’s Offshore Wind: Analyzing LCOE and IRR Across 12 Promotion Zones
1. Area Overview
- Area Name: Hiyama Offshore
- Location: Southwest Offshore, Hokkaido
- Estimated Capacity: 1140 MW
- Status: Promotion Zone
- Potential Developer: Hokkaido Electric Power, J-POWER and others
2. Assumptions (Representative Values)
In this article, the representative point was set at the center of the designated promotion area polygon based on its coordinates. Water depth and distance conditions were estimated using data from NeoWins.
Since the offshore area off Hiyama, Hokkaido is divided into two zones—north and south—the representative points were also set as two points, one in the north and one in the south.
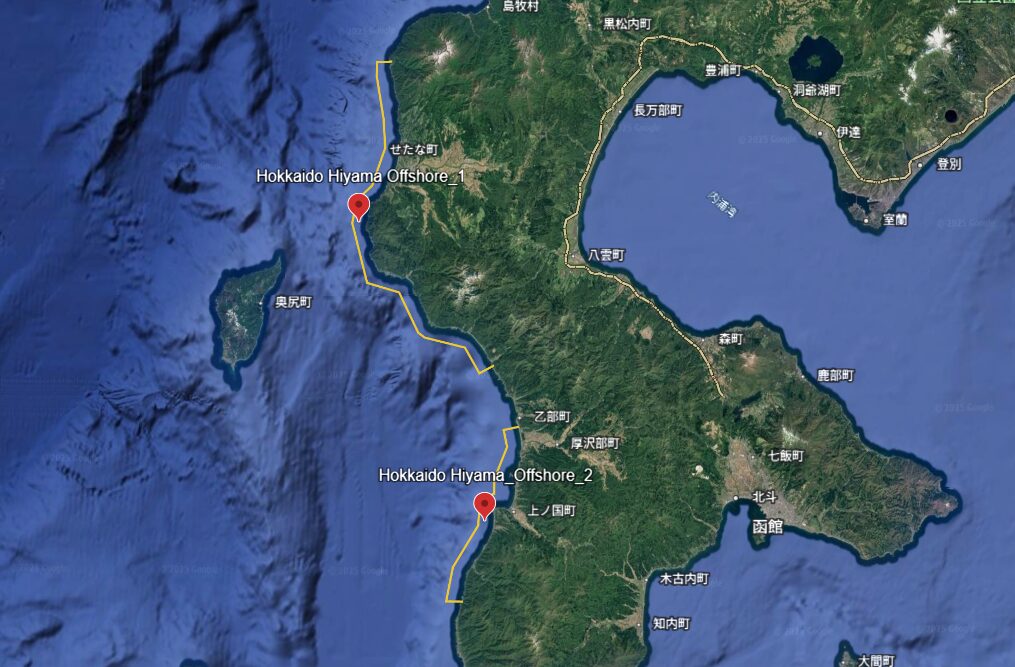
2-1. Representative Point 1 (North)
| Item | Estimated Value | Notes |
|---|---|---|
| Water Depth (m) | 48 m | Depth at representative point |
| Distance to Shore (km) | 1.2 km | Shortest distance to landfall point |
| Distance to Port (km) | 17 km | Straight-line distance to assumed O&M port |
2-2. Representative Point 2 (South)
| Item | Estimated Value | Notes |
|---|---|---|
| Water Depth (m) | 45 m | Depth at representative point |
| Distance to Shore (km) | 0.9 km | Shortest distance to landfall point |
| Distance to Port (km) | 11 km | Straight-line distance to assumed O&M port |
3. CAPEX / OPEX Estimates
CAPEX and OPEX were independently estimated by DeepWind with reference to JWPA’s developer survey results and international benchmarks.
| Foundation Type | Estimated CAPEX | Estimated OPEX |
|---|---|---|
| Monopile (North) | Approx. JPY 974 B | Approx. JPY 15.8 B per year |
| Monopile (South) | Approx. JPY 967 B | Approx. JPY 15.7 B per year |
| Average | Approx. JPY 971 B | Approx. JPY 15.8 B per year |
4. LCOE Estimate
The LCOE was independently estimated by DeepWind with reference to NEDO’s Offshore Wind Cost Model (October 2024) and NeoWins data.
| Foundation Type | Gross CF | WACC | Estimated LCOE |
|---|---|---|---|
| Monopile (North) | 41% | 3% | 21.9 JPY/kWh |
| Monopile (South) | 47% | 3% | 18.7 JPY/kWh |
| Average | 44% | 3% | 20.3 JPY/kWh |
5. IRR Estimate
| Foundation Type | Estimated IRR | Modeled Power Selling Price | Assumed Operating Period |
|---|---|---|---|
| Monopile (North) | 4.6 % | 25 JPY/kWh | 25 years |
| Monopile (South) | 6.5 % | 20 JPY/kWh | 25 years |
| Average | 5.6% | – | – |
6. Profitability Rating (DeepWind Independent Evaluation)
| Evaluation Metric | Score (★1–5) | Result |
|---|---|---|
| Profitability | ★★★★ | Attractive |
| Overall Rating | A Rank | High investment potential; profitability achievable depending on site conditions (port and grid distance, etc.). |
Conclusion
The offshore wind project off the coast of Hiyama, Hokkaido can be evaluated as a highly cost-competitive area, as indicated by the representative-point analysis. Its relatively shallow water depth and favorable access to nearby ports contribute to strong economic performance. Estimated CAPEX and OPEX levels are better than those of many other Promotion Zones, resulting in an LCOE in the low-¥20/kWh range—sufficiently attractive from an investment-feasibility standpoint.
There are also differences in average wind speeds and distance conditions between the northern and southern parts of the area. In the IRR simulation, the southern portion demonstrated higher profitability.
If you would like to compare the CAPEX, OPEX, LCOE, and IRR of other Promotion Zones, please also check out this summary article.
🌊 Cost Analysis of Japan’s 12 Offshore Wind Promotion Zones
Round 4 Is Not a Reset.📘 DeepWind Premium Report
A concise, decision-oriented structural brief on what actually changed —
and what remains structurally broken.
- 🔍Market Insights – Understand the latest trends and key topics in Japan’s offshore wind market
- 🏛️Policy & Regulations – Explore Japan’s legal frameworks, auction systems, and designated promotion zones.
- 🌊Projects – Get an overview of offshore wind projects across Japan’s coastal regions.
- 🛠️Technology & Innovation – Discover the latest technologies and innovations shaping Japan’s offshore wind sector.
- 💡Cost Analysis – Dive into Japan-specific LCOE insights and offshore wind cost structures.