Introduction
On August 27, 2025, Mitsubishi Corporation announced its formal withdrawal from three of Japan’s largest offshore wind projects, located off Akita and Chiba prefectures. This was not merely a corporate decision but an event that shook the foundations of Japan’s offshore wind policy, long promoted as a national flagship initiative for decarbonization.
The projects were part of the first round of offshore wind auctions in 2021, covering Noshiro–Mitane–Oga (Akita), Yurihonjo (Akita), and Choshi (Chiba). Together they represented an unprecedented 1.7 GW of capacity, led by Mitsubishi in partnership with Chubu Electric’s C-Tech.
At the time, Mitsubishi’s consortium secured all three sites with aggressively low bids, hailed as “price disruption” but also criticized as unrealistic. What appeared to be a bold victory ultimately became the very reason for collapse, once external shocks hit the project economics.
This article analyzes the reasons behind Mitsubishi’s exit using profitability metrics (LCOE and IRR), examines its financial, local, and policy implications, and highlights the critical need for pre-auction profitability assessments. We conclude by showing how DeepWind’s Promotion Zone Cost Analysis helps fill this gap.
For a structured overview of Japan’s offshore wind market—including policy, investment dynamics, costs, and supply-chain constraints—see our pillar article.
👉 Japan Offshore Wind Market Analysis (Pillar)
Chapter 1: Project Overview and Initial Conditions
1.1 First-Round Auction and the Three Sites
- Sites: Noshiro–Mitane–Oga, Yurihonjo, Choshi
- Capacity: 1.7 GW combined
- Outcome: Mitsubishi’s consortium won all three sites with the lowest price bids.
1.2 Risks Embedded in Aggressive Bids
- Low bids required exceptional efficiency in EPC, logistics, and financing.
- However, site-specific factors (water depth, distance from shore, port access, foundation type) were not adequately priced in.
- These gaps set the stage for structural fragility.
Chapter 2: Why Profitability Collapsed – Interacting Factors
2.1 The Economic Shock and Cost Doubling
The total project cost, initially estimated at JPY 1 trillion, ballooned to JPY 2 trillion. Key drivers included:
- Material and EPC inflation: steel, cables, substations, vessels
- Sharp yen depreciation: Japan depends on imported turbines and components
- Global interest rate hikes: financing costs surged, lowering IRR
- Logistical bottlenecks: limited ports, laydown yards, and installation vessels
Together, these created a “perfect storm” that shattered feasibility.
2.2 Structural Weakness of the Auction Scheme
- The first auction lacked inflation adjustment mechanisms for power prices.
- Rising costs were not compensated, leaving developers to absorb risks.
- Later reforms introduced indexation, but Mitsubishi’s projects were excluded from retroactive relief.
2.3 The Limits of “Price Disruption”
- Mitsubishi’s winning bid was reportedly about 5 JPY/kWh lower than competitors.
- While this secured all three sites, it left no buffer for site-specific costs or macroeconomic volatility.
- External shocks were the trigger, but the root cause was a structurally fragile business case.
Chapter 3: DeepWind’s Profitability Analysis – LCOE × IRR
3.1 Metrics for Evaluation
- LCOE (Levelized Cost of Energy): lifecycle cost per kWh, reflecting CAPEX, OPEX, WACC, and utilization.
- IRR (Internal Rate of Return): project-level return indicator, directly affected by sales price, cost structure, and financing.
3.2 Methodology
- All projects were normalized to the same power price (18 JPY/kWh).
- CAPEX/OPEX estimates considered site conditions: distance, depth, foundation type, logistics, O&M access.
- This allows for a fair comparison across Promotion Zones.
3.3 Key Findings
- Scatter plots (IRR vs LCOE) show Mitsubishi-led projects cluster at higher LCOE and lower IRR than other zones.
- Even at 18 JPY/kWh, their IRR fell below 8%, confirming structural unprofitability.
- Site conditions (e.g., jacket foundations, deeper waters, longer logistics chains) compounded disadvantages.
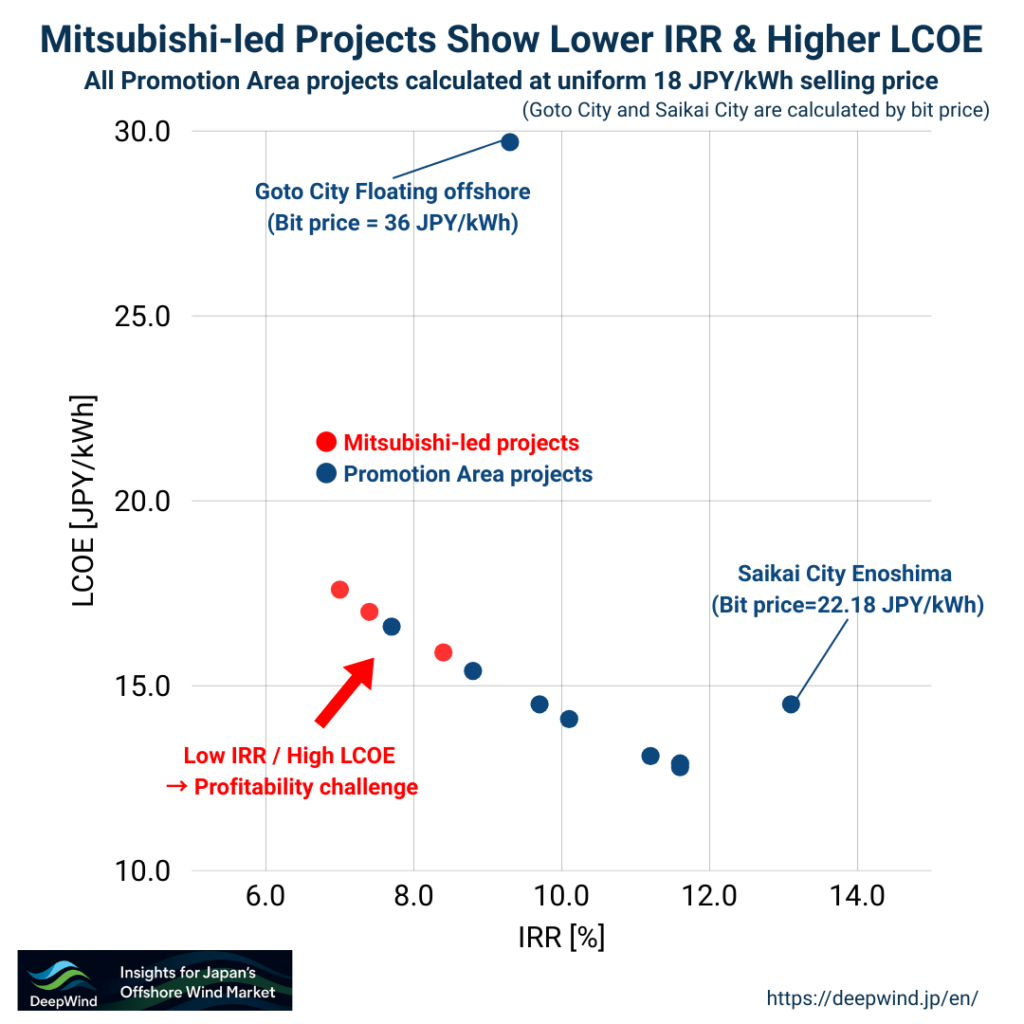
Takeaway: profitability is not determined by bid price alone but by site-specific economics.
Chapter 4: Financial Consequences and Risk Management
4.1 Recorded Losses
- Mitsubishi booked JPY 52.4 billion in impairments.
- About JPY 20 billion in security deposits were forfeited to the government.
- Chubu Electric reported losses of JPY 17–35 billion, depending on estimates.
4.2 Why Exit Was Rational
- Facing a JPY 1 trillion cost overrun, paying a JPY 20 billion penalty was economically rational.
- This decision prevented much larger losses and exemplifies portfolio risk management typical of trading houses.
Chapter 5: Wider Impacts – Local Economies and Market Perceptions
5.1 Local Communities
- Ports in Noshiro and Choshi had already received heavy public investment.
- Promised spillover effects (employment, supply chain growth) were lost, creating local disillusionment.
5.2 Supply Chain Development
- Japan lacks a domestic turbine supply chain.
- Withdrawal delays localization efforts in manufacturing and O&M hubs.
5.3 Investor Confidence
- Financial institutions now apply stricter risk pricing for Japanese offshore wind.
- Without structural reforms, investment appetite could diminish further.
5.4 International Context
- Similar exits occurred in the US and Europe (Ørsted, BP, Shell).
- The difference: in mature markets, policy frameworks allowed repricing or renegotiation.
- Japan’s rigidity exposed developers to asymmetric risks.
Chapter 6: Mitsubishi’s Portfolio Strategy
- Mitsubishi continues investing in renewables overseas:
- Distributed solar (Nexamp, US)
- Offshore wind & hydrogen (Eneco, Shell, EU)
- Withdrawal reflects Japanese-specific risk factors, not rejection of offshore wind as a whole.
- The decision highlights the importance of portfolio diversification and global balancing.
Chapter 7: Lessons for Japan’s Offshore Wind Policy
7.1 Auction Flexibility
- Introduce inflation adjustment clauses for price volatility.
- Share risks more equitably between government and developers.
7.2 Supply Chain Roadmap
- Develop domestic manufacturing, ports, and O&M bases.
- Avoid overpromising unrealistic localization rates.
7.3 Transparency and Data
- Expand site condition data disclosure.
- Institutionalize pre-FEED level dialogues before auctions.
Chapter 8: The Critical Role of Pre-Auction Profitability Assessment
- The Mitsubishi exit proves that pre-auction analysis of LCOE and IRR is essential.
- Same-price normalization reveals structural differences among sites.
- Ignoring these assessments results in fragile business cases vulnerable to shocks.
Checklist for Pre-Auction Evaluation:
- Wind resource reliability and degradation
- Water depth, seabed, and foundation choice
- Logistics and installation constraints
- Grid access and transmission route risks
- O&M accessibility and supply bases
- CAPEX/OPEX benchmarking vs site specifics
- Financing conditions and WACC assumptions
- Sensitivity analysis on costs and revenue
- Risk buffers for contingencies
- Policy design: inflation indexation, renegotiation rules
Chapter 9: DeepWind’s Role – Enabling Data-Driven Decisions
9.1 Promotion Zone Cost Analysis
DeepWind has modeled CAPEX, OPEX, LCOE, and IRR for all 12 designated Promotion Zones using consistent assumptions. This enables:
- Developers to assess site-specific risks before bidding
- Lenders to price financial feasibility more accurately
- Policymakers to identify systemic weaknesses in auction design
9.2 Visualization and Insights
- IRR vs LCOE scatter plots clearly show Mitsubishi-led sites clustering at high LCOE/low IRR.
- Comparative normalization illustrates why profitability challenges were predictable.
👉 Promotion Zone Cost Analysis: LCOE & IRR Comparison
Conclusion
Mitsubishi’s offshore wind exit was caused by a confluence of aggressive bidding, inflationary shocks, yen depreciation, rising interest rates, and rigid auction rules. It underscores the urgent need for:
- Flexible auction mechanisms with inflation clauses
- Robust domestic supply chains to reduce import dependency
- Transparent pre-auction data and dialogue to improve realism
Above all, it demonstrates that pre-auction profitability assessment using LCOE and IRR is indispensable.
DeepWind’s analysis of all Promotion Zones offers the tools to make such assessments, supporting data-driven decision-making for developers, financiers, and policymakers. The Mitsubishi case should not be seen as an isolated failure, but as a critical lesson to reshape Japan’s offshore wind strategy for sustainable growth.
👉 Explore DeepWind’s Promotion Zone Cost Analysis
Japan’s offshore wind market cannot be understood through a single lens. A cross-cutting view—integrating policy, investment behavior, cost structures, and execution capability—is consolidated in our pillar article.
👉 Japan Offshore Wind Market Analysis (Pillar)
Round 4 Is Not a Reset.📘 DeepWind Premium Report
A concise, decision-oriented structural brief on what actually changed —
and what remains structurally broken.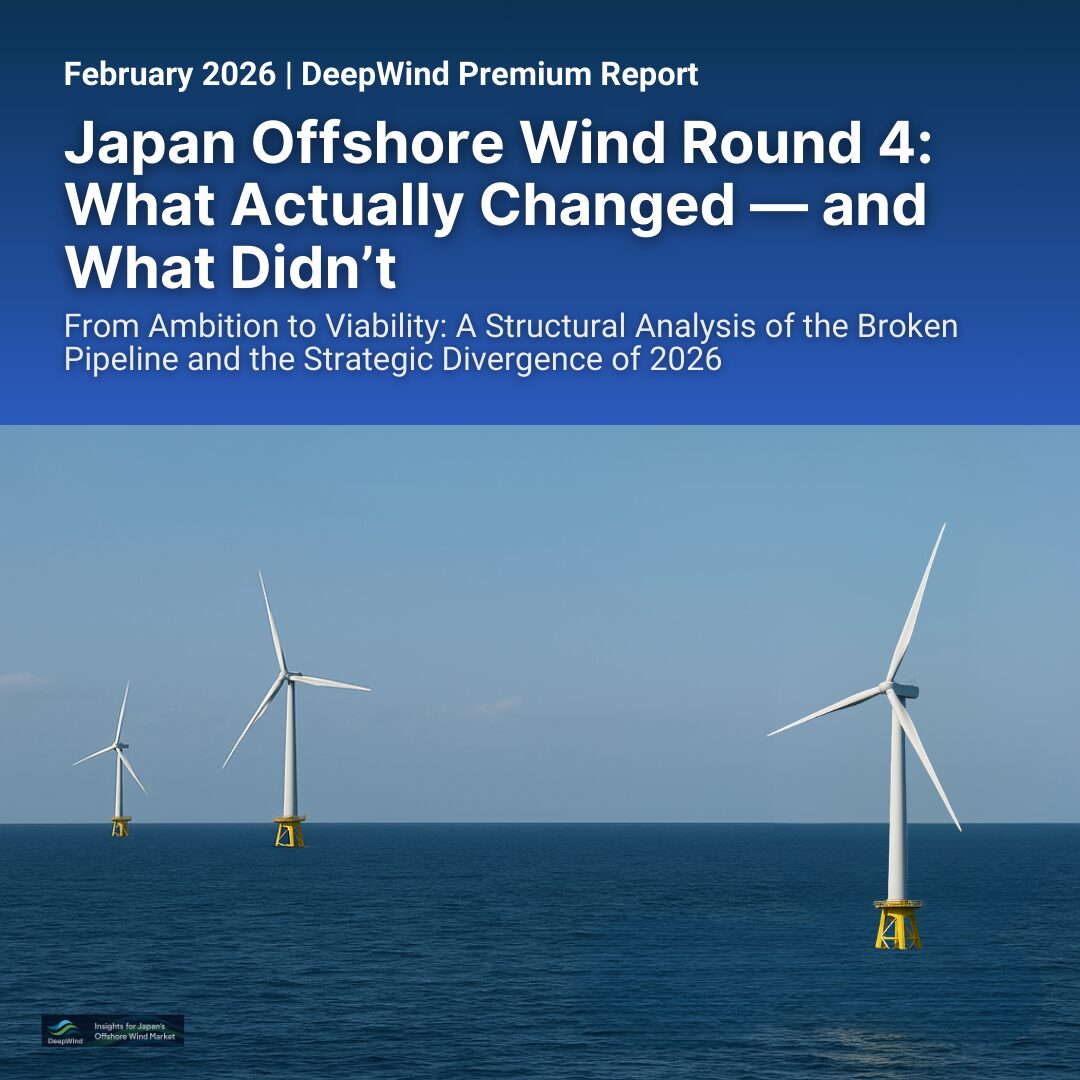
- 🔍Market Insights – Understand the latest trends and key topics in Japan’s offshore wind market
- 🏛️Policy & Regulations – Explore Japan’s legal frameworks, auction systems, and designated promotion zones.
- 🌊Projects – Get an overview of offshore wind projects across Japan’s coastal regions.
- 🛠️Technology & Innovation – Discover the latest technologies and innovations shaping Japan’s offshore wind sector.
- 💡Cost Analysis – Dive into Japan-specific LCOE insights and offshore wind cost structures.