Introduction
One of the most critical factors in commercializing floating offshore wind is controlling cost structure. Investors and developers need clarity on how large-scale deployments and technological advancements can lower LCOE (Levelized Cost of Electricity). This article breaks down CAPEX and OPEX line items in detail and presents an LCOE case study to reveal the economic reality of floating systems.
While this article dives into a specific topic, we recommend starting with this summary article for a full understanding of floating offshore wind’s key structures and technologies:
👉 The Basics of Floating Offshore Wind: Key Structures and Technologies
While this article focuses on a specific cost-related aspect, we recommend this summary article for a comprehensive overview of offshore wind cost structure and economic outlook:
👉 Cost Structure and Economics of Offshore Wind
1. CAPEX Breakdown
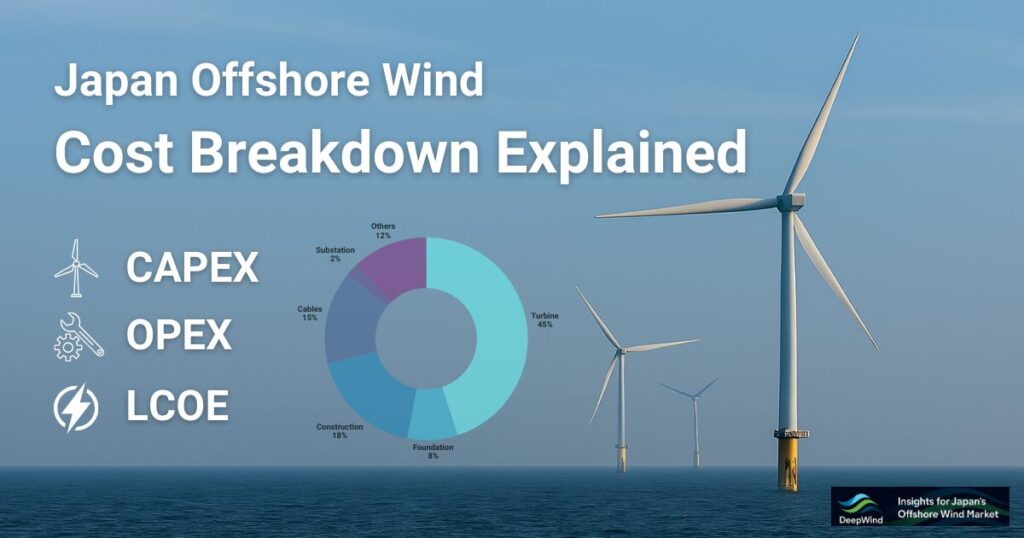
Initial capital expenditure (CAPEX) for floating offshore wind is the largest single investment component. It can be divided into five major categories, each of which varies significantly with project scale and site conditions:
- Turbine Unit Cost
• Manufacturing: 15 MW+ turbines require high-strength composites and precision machining; typical cost ranges from €1.0 – 1.5 million per MW. Advanced materials (carbon fiber blades, high-torque generators) and efficiency upgrades push costs upward.
• Transport & Pre-installation: Sea transport to port, dry-dock assembly, crane lifts, and quality testing add roughly 5 – 10 % of turbine manufacturing cost. - Platform Fabrication & Transport
• Hull Fabrication: Semi-submersible, SPAR, barge, or TLP hulls require large-scale steel welding and specialized assembly; module costs typically run €0.8 – 1.2 million per MW, depending on design reuse and mass-production level.
• Port Assembly & Towage: Completed hulls are towed to site by tug over 100 – 300 km; towage costs about €200 – 300k per operation, translating to €0.1 – 0.2 million per MW once insurance and attachments are included. - Installation & Mooring Works
• Vessel Charter: Self-Elevating Platforms (SEP) or DP vessels cost €200 – 300k per day. A typical installation of one unit takes 10 – 15 days, yielding €2.0 – 4.5 million per MW.
• Mooring & Anchor Installation: Catenary or tension-leg anchor installation, seabed surveys, and dedicated installation vessels cost about €0.2 – 0.4 million per MW. - Grid Connection Infrastructure
• Subsea Cables: AC or DC cables cost €0.3 – 0.5 million per km. For distances over 20 km, HVDC converters (€1.5 – 2.5 million per converter) become cost-effective.
• Onshore Substation & Grid Tie-in: Cable landings, substation construction, and grid interconnection add €0.1 – 0.2 million per MW, including environmental assessments and local consultations. - Engineering, Certification & EIA
• Engineering & Design: Detailed platform, mooring, and grid integration studies amount to 3 – 5 % of total CAPEX (~€0.1 – 0.15 million per MW).
• Certification Fees: DNV, ClassNK, and others charge for design reviews, FAT, and SAT—approximately €20 – 50k per MW (~€0.02 – 0.05 million per MW).
• Environmental Impact Assessment (EIA): Marine biology, noise, visual, and cultural heritage surveys cost roughly €0.03 – 0.1 million per MW.
Estimated Total CAPEX: ~€3.4 million per MW
2. OPEX Breakdown
Operating expenditure (OPEX) occurs annually once the farm is operational. Key cost elements include:
- Scheduled Maintenance
• Drone & ROV Inspections: Unmanned aerial and underwater inspections cost €100 – 200k per mission.
• Crew & Vessel Charter: Technicians and crew aboard maintenance vessels (20–30 days/year at €20 – 30k/day) total ~€0.08–0.12 million per MW per year. - Component Replacement & Emergency Repairs
• Major Component Swaps: Gearboxes, generators, bearings, and blades replaced based on MTBF; ~€0.03–0.05 million per MW per year.
• Subsea Cable Repairs: Anchor impacts or wear may require €0.1 million+ per event, with costs spread via insurance or pooled risk funds. - Operations Management & Monitoring
• SCADA & Analytics: 24/7 remote monitoring, data analytics, and staff support €0.02–0.04 million per MW.
• Predictive Maintenance Software: AI-driven vibration and temperature monitoring licenses near €0.01 million per MW. - Offshore Access Costs
• Vessel fuel, maintenance, and standby time for weather delays add €0.02–0.03 million per MW per year.
• Contingency for weather downtime typically 5–10 % of OPEX budget. - Insurance & Risk Financing
• Property damage & business interruption insurance costs €0.03–0.06 million per MW per year.
• FX, political, and supply chain hedges add ~€0.01 million per MW.
Estimated Total OPEX: ~€0.25–0.30 million per MW per year
3. LCOE Case Study (Nagasaki Goto Floating Wind)
Here is the estimated LCOE for the floating offshore wind project off Goto City, Nagasaki Prefecture.
The calculation assumes a weighted average cost of capital (WACC) of 3.0%, a 25-year operating period, and a gross capacity factor of 31%.
| Floating type | Estimated CAPEX | Estimated OPEX | Estimated LCOE |
|---|---|---|---|
| Spar | Approx. JPY 22.5 B | Approx. JPY 200 M per year | 41.4 JPY/kWh |
Read full article 👉Nagasaki Goto City Offshore Floating Wind: Cost Analysis
4. Cost Reduction Strategies
To enhance the economic competitiveness of floating offshore wind, deploy a multi-faceted cost reduction program:
- Pursue Economies of Scale
• Scale project size from 100 MW to 500 MW and 1 GW to leverage bulk procurement, standardized construction methods, and optimized installation campaigns; potential CAPEX reduction of 10–15 % at ≥1 GW scale. - Drive Technological Innovation & Standardization
• Adopt modular platform designs to reduce engineering and verification cycles.
• Explore next-gen structures: hybrid steel-concrete SPARs, vertical-axis turbines, and advanced lightweight materials to cut steel tonnage while boosting stiffness. - Enhance O&M Efficiency
• Implement digital twins and AI predictive maintenance to shift from break-fix to plan-fix, reducing downtime by ~30 %.
• Employ autonomous drones and ROVs for routine inspections, cutting crew and vessel costs by 20–25 %. - Optimize Supply Chain
• Cluster fabrication at domestic shipyards to cut transport and currency risks.
• Diversify turbine and cable suppliers to secure competitive pricing and reduce lead-time exposure. - Leverage Finance & Policy Support
• Maximize grants from NEDO and regional revitalization funds for feasibility, demonstration, and EIA costs.
• Tap green bonds and ESG-linked loans to lower financing costs by 1–2 percentage points.
• Pool early-phase risks via government guarantees or industry insurance schemes.
Conclusion & What’s Next
Although the current LCOE for floating offshore wind remains high and requires policy support, there is further potential for reduction through larger project scale and continued technological development. In Part 4, we will explore Japan’s regulatory framework, certification processes, and on-site challenges through real project examples. Stay tuned!
To further explore the fundamental structures and design concepts of floating offshore wind, check out our in-depth overview here:
🌊 The Basics of Floating Offshore Wind: Key Structures and Technologies
If you’re interested in a deeper understanding of offshore wind costs—including both fixed-bottom and floating projects—don’t miss our in-depth overview article:
🌊 Cost Structure and Economics of Offshore Wind
Explore more categories at DeepWind:
- 🔍Market Insights – Understand the latest trends and key topics in Japan’s offshore wind market
- 🏛️Policy & Regulations – Explore Japan’s legal frameworks, auction systems, and designated promotion zones.
- 🌊Projects – Get an overview of offshore wind projects across Japan’s coastal regions.
- 🛠️Technology & Innovation – Discover the latest technologies and innovations shaping Japan’s offshore wind sector.
- 💡Cost Analysis – Dive into Japan-specific LCOE insights and offshore wind cost structures.


